
 Price Surges 7% as Traders Eye Critical $100 Breakout Level")
TLDR
- Solana’s price jumped more than 7% within 24 hours, hitting a peak of $97.67 while the overall crypto market increased by roughly 3.6%.
- The total value locked on Solana’s blockchain increased by 25% throughout the past month, reflecting renewed user engagement.
- SOL currently trades above the $92 level and its 100-hour simple moving average, supported by a bullish trend line near $94.
- Critical resistance zones are positioned at $98 and $100, while support can be found at $92 and $88 during potential corrections.
- The token has rallied over 40% from its February bottom, accompanied by an RSI climbing toward 60 after recovering from oversold territory.
Solana has delivered an impressive 24-hour performance, surging more than 7% to touch a peak of $97.67 before entering a consolidation phase around the $95 level. This upward movement aligns with a broader cryptocurrency market rebound, which saw gains of approximately 3.6% during the same timeframe.
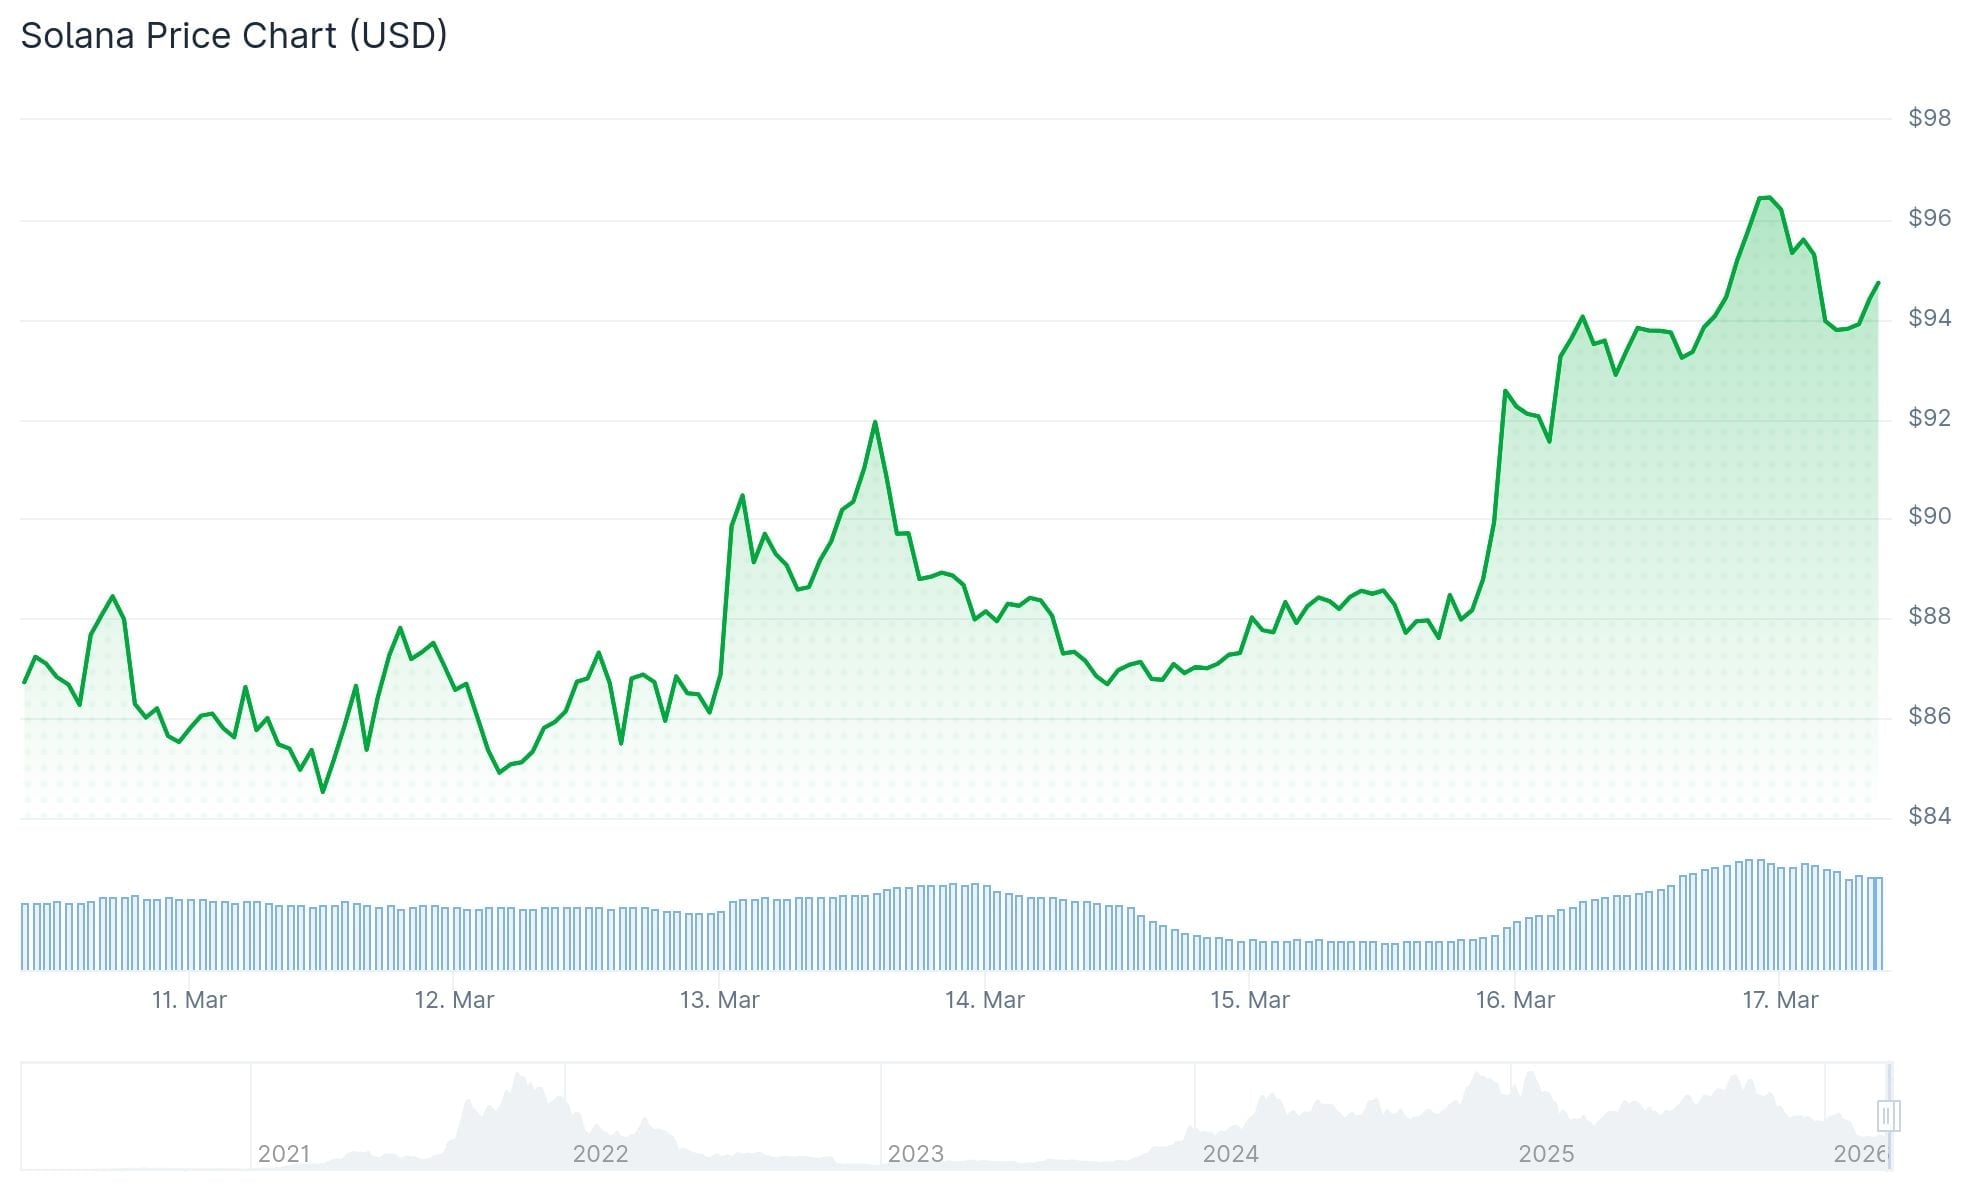
As of this writing, SOL maintains its position above the $92 threshold and continues trading above the 100-hour simple moving average. Technical analysis reveals a bullish trend line providing support at the $94 level on the hourly timeframe, according to data sourced from Kraken.
Critical Resistance Zones Ahead
The cryptocurrency now confronts immediate resistance around the $95 zone, with the subsequent significant barrier positioned at $98. However, the $100 psychological level represents the most crucial challenge ahead. Successfully breaking and closing above $100 could pave the way for advances toward $105 and possibly $112.
Conversely, should SOL lose its footing above $92, the nearest support zone rests at $88. A breakdown beneath $88 might bring the $82 level into play.
While the recent surge correlates with the wider market recovery, Solana has notably outperformed the majority of other top-10 cryptocurrencies during this period.

On-Chain Metrics Reinforce Bullish Sentiment
The total value locked across Solana’s ecosystem expanded by 25% throughout the previous month. TVL represents the amount of capital deployed within a blockchain’s protocols, and an increase of this magnitude indicates heightened platform engagement.
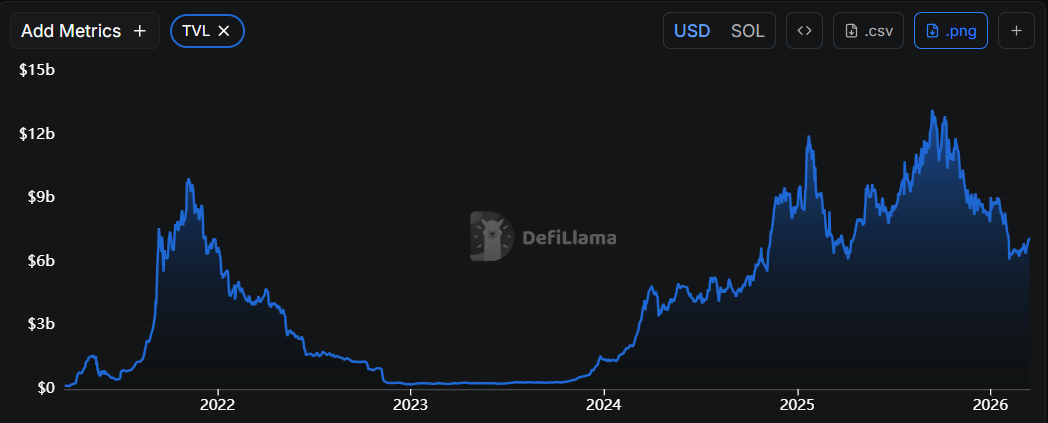
Development activity and new decentralized application deployments on the network have maintained consistent levels. These fundamental on-chain indicators have contributed to supporting the current bullish price action.
Solana has appreciated more than 40% since establishing its February low point. The Relative Strength Index has advanced back toward the 60 threshold following a recovery from oversold conditions experienced earlier this year.
Price action has been oscillating within a defined range between $80 support and $95 resistance over recent weeks, creating a consolidation structure that market participants frequently monitor for potential breakout opportunities.
The 200-day moving average continues to trade above current price levels, suggesting that the longer-term bullish trend has yet to fully establish itself.
SOL is currently valued at approximately $94.62, commanding a market capitalization near $54 billion, with a 52-week trading range spanning from $70.61 to $252.78.
Get 3 Free Stock Ebooks
Discover top-performing stocks in AI, Crypto, and Technology with expert analysis.
- Top 10 AI Stocks - Leading AI companies
- Top 10 Crypto Stocks - Blockchain leaders
- Top 10 Tech Stocks - Tech giants


