
 Crushes Gold and S&P 500 Performance During U.S.-Iran Conflict")
Key Takeaways
- BTC experienced an initial 8.5% decline at the onset of U.S.-Iran hostilities but has rebounded approximately 11% from its lowest level.
- Despite repeated sell-offs following each escalation event, Bitcoin has consistently found support at progressively higher price points.
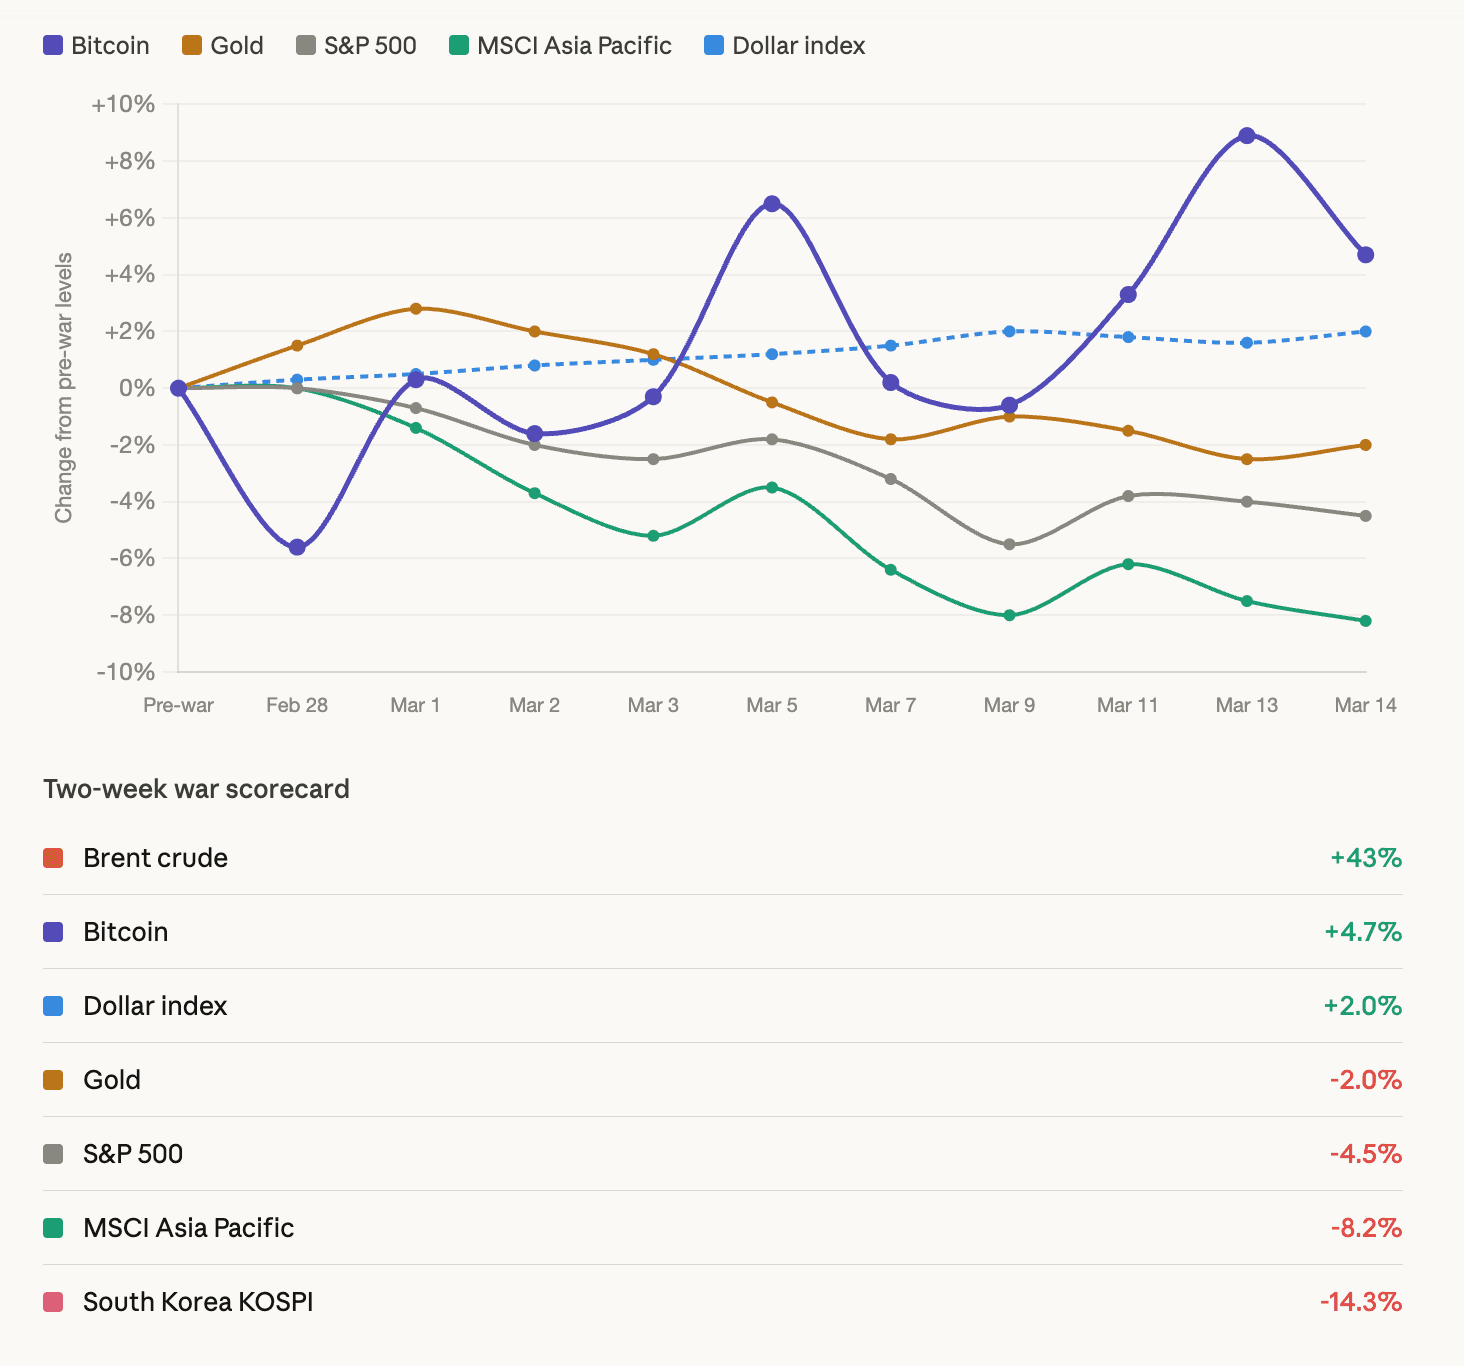
- Over the two-week conflict period, BTC has delivered superior returns compared to both gold and the S&P 500.
- Major Bitcoin holders (whales) have resumed accumulation patterns around $71,000, now commanding 68.17% of circulating supply.
- Blockchain analytics indicate minimal selling pressure exists between current valuations and approximately $82,000.
Bitcoin currently sits at a $71,500 valuation.
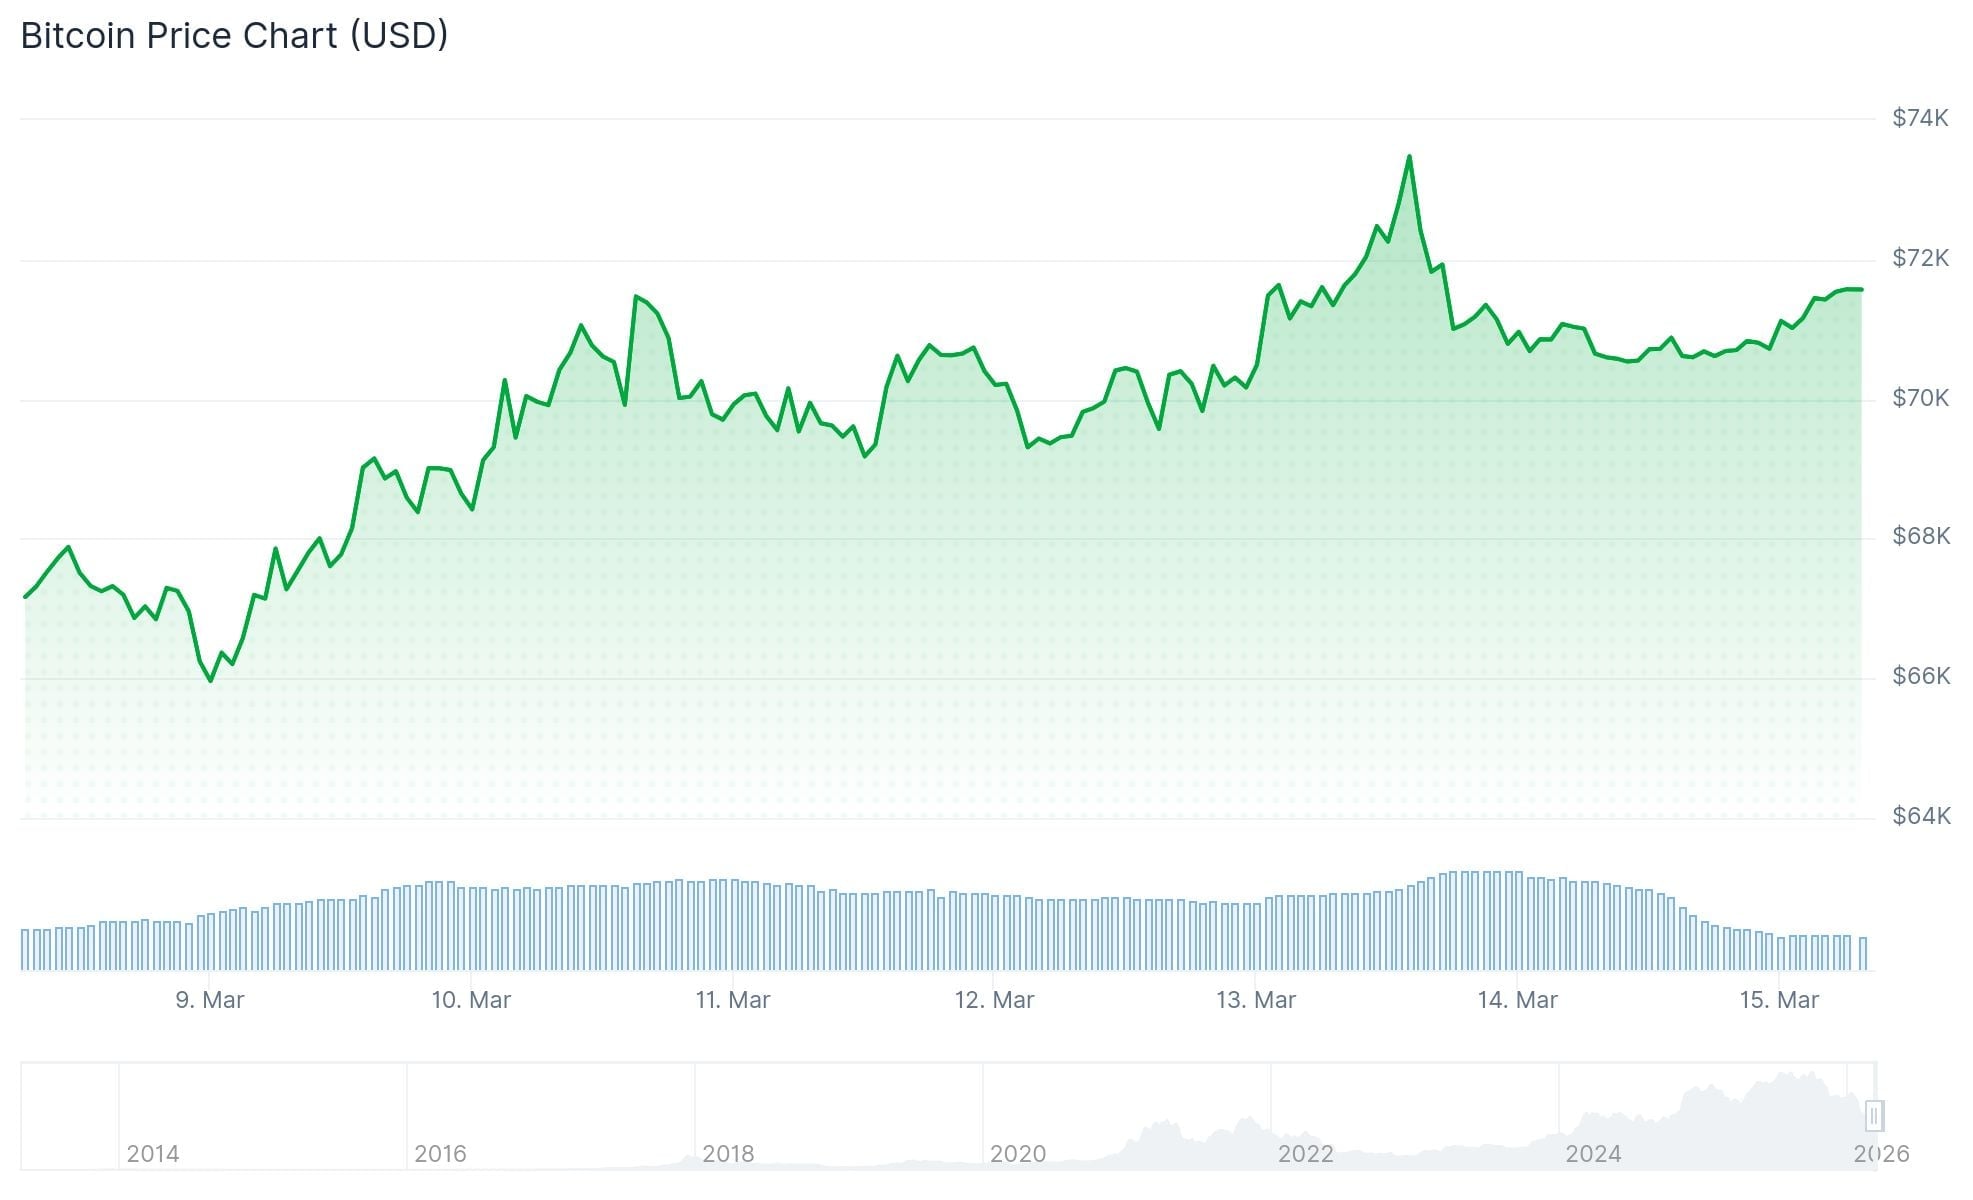
Hostilities between the United States and Iran commenced on Saturday, February 28. As the sole major financial market operating during weekend hours, Bitcoin bore the immediate impact, plummeting 8.5% to reach $64,000—marking its nadir.
Fast forward two weeks, and the landscape has shifted considerably.
From that bottom, Bitcoin has surged approximately 11%, establishing itself around the $71,500 mark. During this identical timeframe, gold has experienced significant swings, the S&P 500 has declined, and Asian stock exchanges endured their most severe weekly losses since 2020. Exclusively oil—soaring beyond 40%—and the U.S. dollar have exceeded Bitcoin’s performance. Both assets derive direct advantages from the ongoing conflict.

Progressive Support Levels Following Each Downturn
Each military escalation since February 28 has precipitated Bitcoin selling pressure. However, demand has materialized at incrementally higher thresholds with each occurrence.
Following Iran’s counterstrike missile barrage on March 2, Bitcoin found its floor at $66,000. After sustained hostilities through March 7, support emerged at $68,000. The tanker assaults on March 12 saw BTC maintain $69,400. Post-Kharg Island incident on March 14, the minimum reached $70,596.
This pattern reveals ascending support climbing approximately $1,000–$2,000 following each major development.
Concurrently, Bitcoin has encountered rejection on four occasions approaching the $73,000–$74,000 zone. This resistance level remains intact. A resolution approaches—either Bitcoin penetrates above $74,000, or a significant escalation finally overpowers purchasing demand.
Earlier in the year, an abrupt liquidation cascade eliminated $2.5 billion in leveraged trading positions during a single weekend, pulling Bitcoin down to $77,000. That shakeout seemingly purged excessive leverage from the system, creating a market structure that has subsequently weathered continuous war-related news without comparable disruption.
Large Holders Buying, Blockchain Metrics Suggest $82K Target
Information from cryptocurrency intelligence platform Santiment reveals substantial Bitcoin wallets—those containing 10 to 10,000 BTC—have reinitiated accumulation behavior near the $71,000 level.
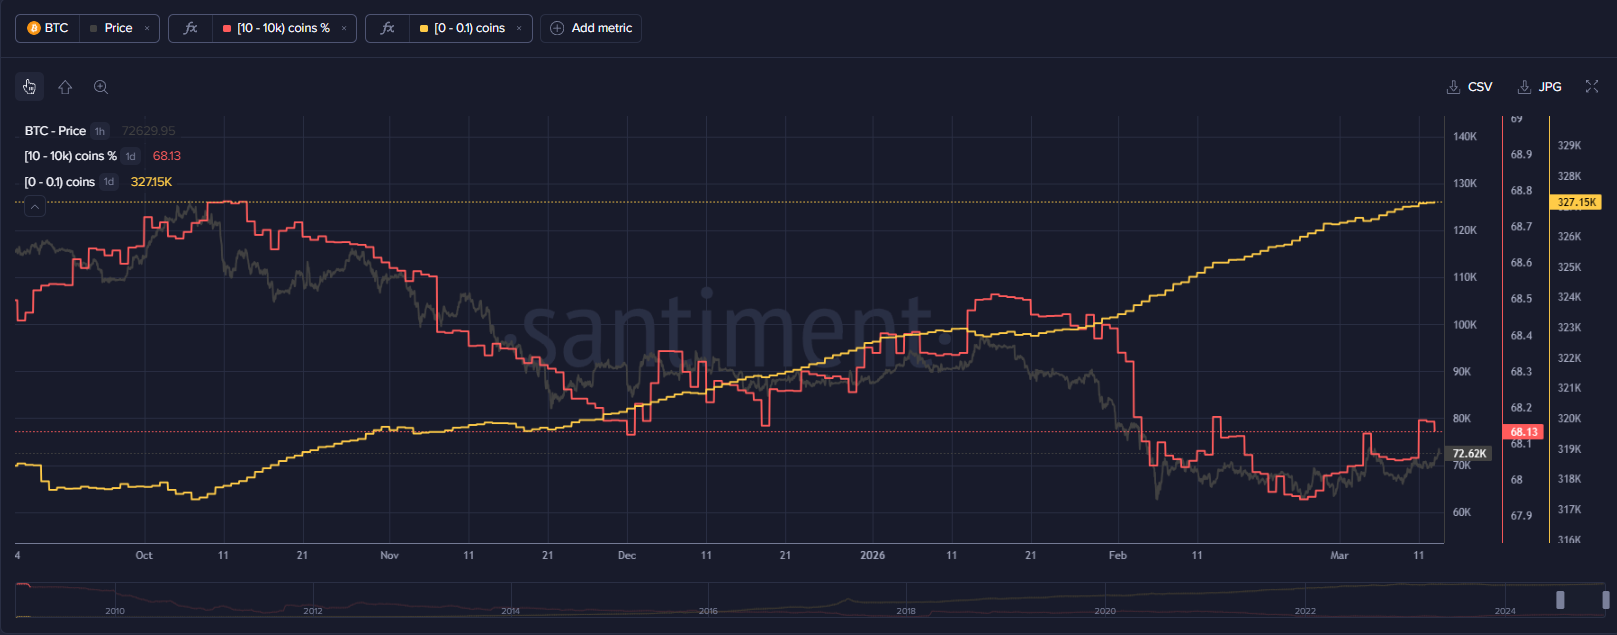
These addresses currently possess 68.17% of Bitcoin’s aggregate supply, increasing from 68.07% seven days prior. Santiment characterized this movement as a “positive reversal.” The analytics firm is monitoring whether retail participants begin distribution, which has historically indicated bottom formation.
The Crypto Fear & Greed Index registered 16 on Sunday—solidly within “Extreme Fear” territory.
United States spot Bitcoin ETFs recorded their inaugural five-consecutive-day inflow sequence of 2026 this week, attracting approximately $767 million in capital.
Blockchain researcher Ali Martinez, referencing the UTXO Realized Price Distribution indicator, highlighted that Bitcoin presently encounters minimal overhead resistance between current levels and approximately $82,045. The $74,000 rejection area, he observed, displays limited investor cost-basis concentration, implying it may prove less formidable than surface appearance suggests.
The subsequent major demand zone beneath present prices exists around $66,898.
Bitcoin has gained 7.55% throughout the previous 30-day period. BTC presently trades at $71,500.
Get 3 Free Stock Ebooks
Discover top-performing stocks in AI, Crypto, and Technology with expert analysis.
- Top 10 AI Stocks - Leading AI companies
- Top 10 Crypto Stocks - Blockchain leaders
- Top 10 Tech Stocks - Tech giants


