
 Dips Under $70K as Middle East Oil Crisis Escalates")
Key Highlights
- BTC declined to $69,393 following strikes on oil tankers in Iraqi territorial waters that propelled Brent crude past the $100 threshold.
- Tehran announced a strategic pivot toward “continuous strikes” rather than “reciprocal hits,” with warnings that oil could reach $200 per barrel.
- Maritime traffic carrying petroleum to Israel and America faces ongoing blockades at the Strait of Hormuz.
- Blockchain analytics reveal apparent BTC demand at -30,800 coins across a 30-day window, while sentiment indicators maintain bearish positioning.
- The upcoming Federal Reserve policy meeting scheduled for March 17-18 draws closer, with elevated oil prices diminishing expectations for monetary easing.
Bitcoin tumbled beneath the $70,000 threshold on Thursday following military strikes targeting oil tankers in Iraqi territorial waters, which sent Brent crude soaring back above the $100 per barrel mark.
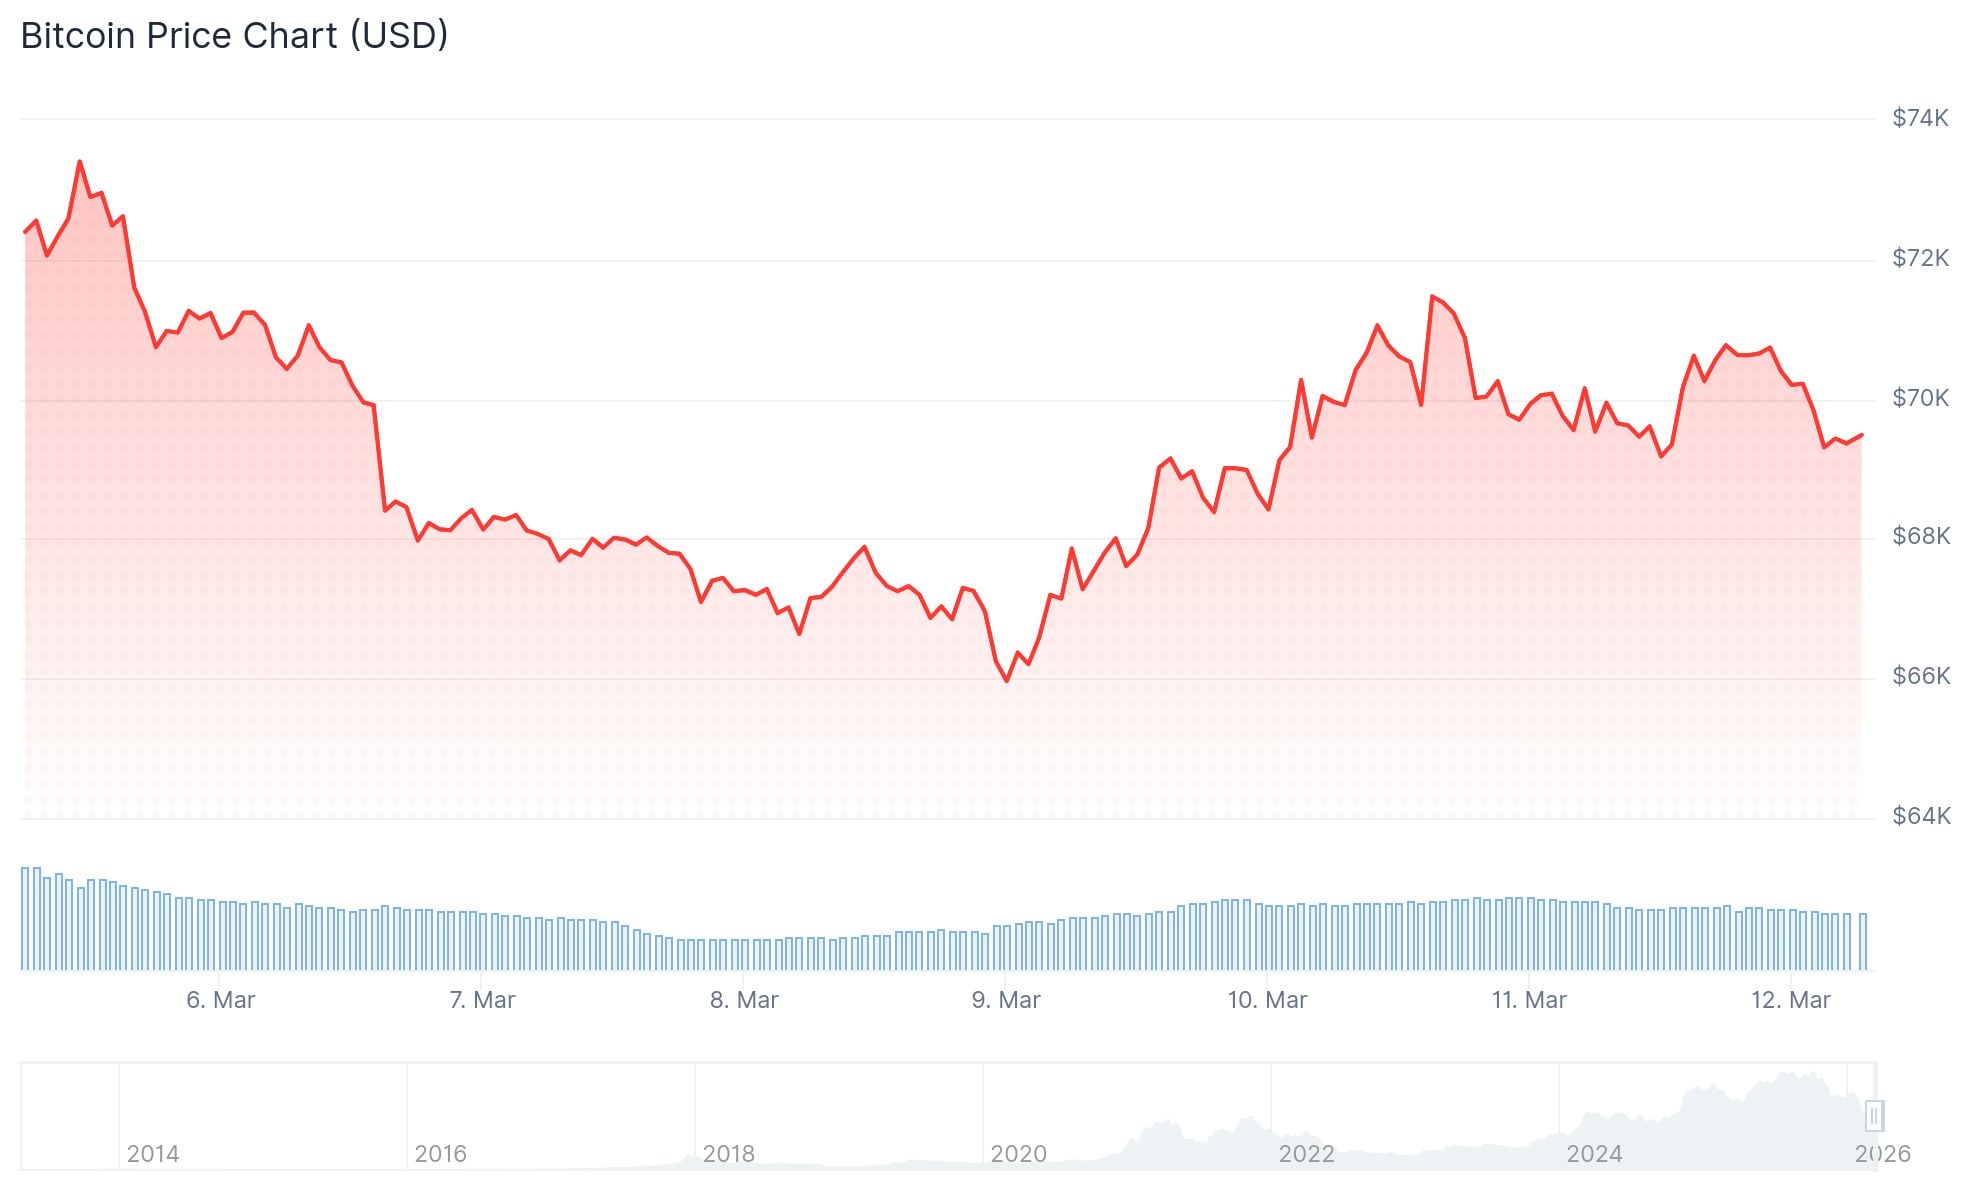
The leading cryptocurrency retreated to $69,393, representing a 0.8% decline over 24 hours and a 4.3% weekly loss. Late Wednesday saw BTC momentarily touch $71,230 before geopolitical developments triggered the selloff, wiping out nearly $2,000 in valuation within hours.
This marks the third occasion in the past fortnight that Bitcoin has attempted to breach $71,000, only to face rejection driven by escalating Middle Eastern tensions.
Brent crude experienced a dramatic surge of up to 10.5% during Thursday’s trading session. Multiple factors contributed to the spike: the tanker strikes, ongoing Persian Gulf military operations, the evacuation of Oman’s Mina Al Fahal port facility, and skepticism regarding the effectiveness of the IEA’s proposed reserve deployment.
While the International Energy Agency suggested releasing 400 million barrels from strategic stockpiles, market participants remain unconvinced about its adequacy in addressing supply constraints.

Tehran Announces Strategic Escalation
Iran’s Islamic Revolutionary Guard Corps declared a fundamental shift in military approach, transitioning from “reciprocal hits” to a sustained campaign of “continuous strikes.” Tehran simultaneously reaffirmed its commitment to obstructing vessels transporting petroleum destined for Israel and the United States through the strategically vital Strait of Hormuz.
Iranian officials have publicly stated their objective of pushing global crude oil valuations to $200 per barrel.
President Trump indicated earlier this week that hostilities would conclude “very soon” and that strategic military goals were “pretty well complete.” Iran’s latest proclamation directly contradicts that assessment.
Emerging intelligence suggests American interceptor missile stockpiles are depleting, potentially prolonging the regional confrontation.
Cryptocurrency Market Repercussions
The digital asset ecosystem experienced widespread declines in tandem with Bitcoin‘s retreat. Ethereum slipped to $2,025, losing 0.5% daily and 4.5% across the week. Solana decreased 1.5% to $85, accumulating a seven-day loss of 5.7%.
XRP shed 0.8% to reach $1.37. Dogecoin declined 0.8% to $0.092, surrendering most of Tuesday’s Elon Musk-related momentum. BNB remained unchanged at $642.
MSCI’s Asia Pacific equity benchmark dropped 1.8%, with energy stocks representing the sole sector registering gains.
Blockchain analytics platforms indicate apparent Bitcoin demand registered at -30,800 BTC measured over 30 days. CryptoQuant’s proprietary bull-bear market indicator persists in bearish territory. The volume of supply held at unrealized losses continues expanding, while price rallies encounter consistent selling pressure.
February’s US inflation data showed headline CPI at 2.4% and core inflation at 2.5%, both exceeding the Federal Reserve’s 2% policy target.
The Federal Reserve’s policy committee convenes March 17-18. With crude oil trading above $100 and inflationary pressures remaining elevated, prospects for near-term interest rate reductions appear diminished.
Bitcoin’s technical structure displays a developing bearish flag formation on daily timeframes, with price action positioned beneath both the 50-day and 100-day exponential moving averages while the Supertrend indicator maintains a bearish signal.
Get 3 Free Stock Ebooks
Discover top-performing stocks in AI, Crypto, and Technology with expert analysis.
- Top 10 AI Stocks - Leading AI companies
- Top 10 Crypto Stocks - Blockchain leaders
- Top 10 Tech Stocks - Tech giants


