
 Price: Record Leverage and Short Squeeze Potential Draw Trader Interest")
TLDR
- Ethereum is maintaining price action near $2,050, defending the critical $2,000 psychological barrier
- The leverage ratio reached an unprecedented 0.78, indicating maximum use of borrowed funds by traders
- Approximately $273 million worth of short positions face liquidation risks just above the current trading range near $2,030
- Weekly RSI stands at 33, hovering close to the oversold zone of 30
- Critical price zones: $2,120 represents upside resistance, while $1,930 marks downside support
The second-largest cryptocurrency has been consolidating within a narrow corridor for several weeks, and the standoff around the $2,000 mark is capturing significant trader focus. With borrowing ratios reaching historic peaks and a substantial concentration of bearish bets positioned directly above, any breakout could trigger substantial volatility.
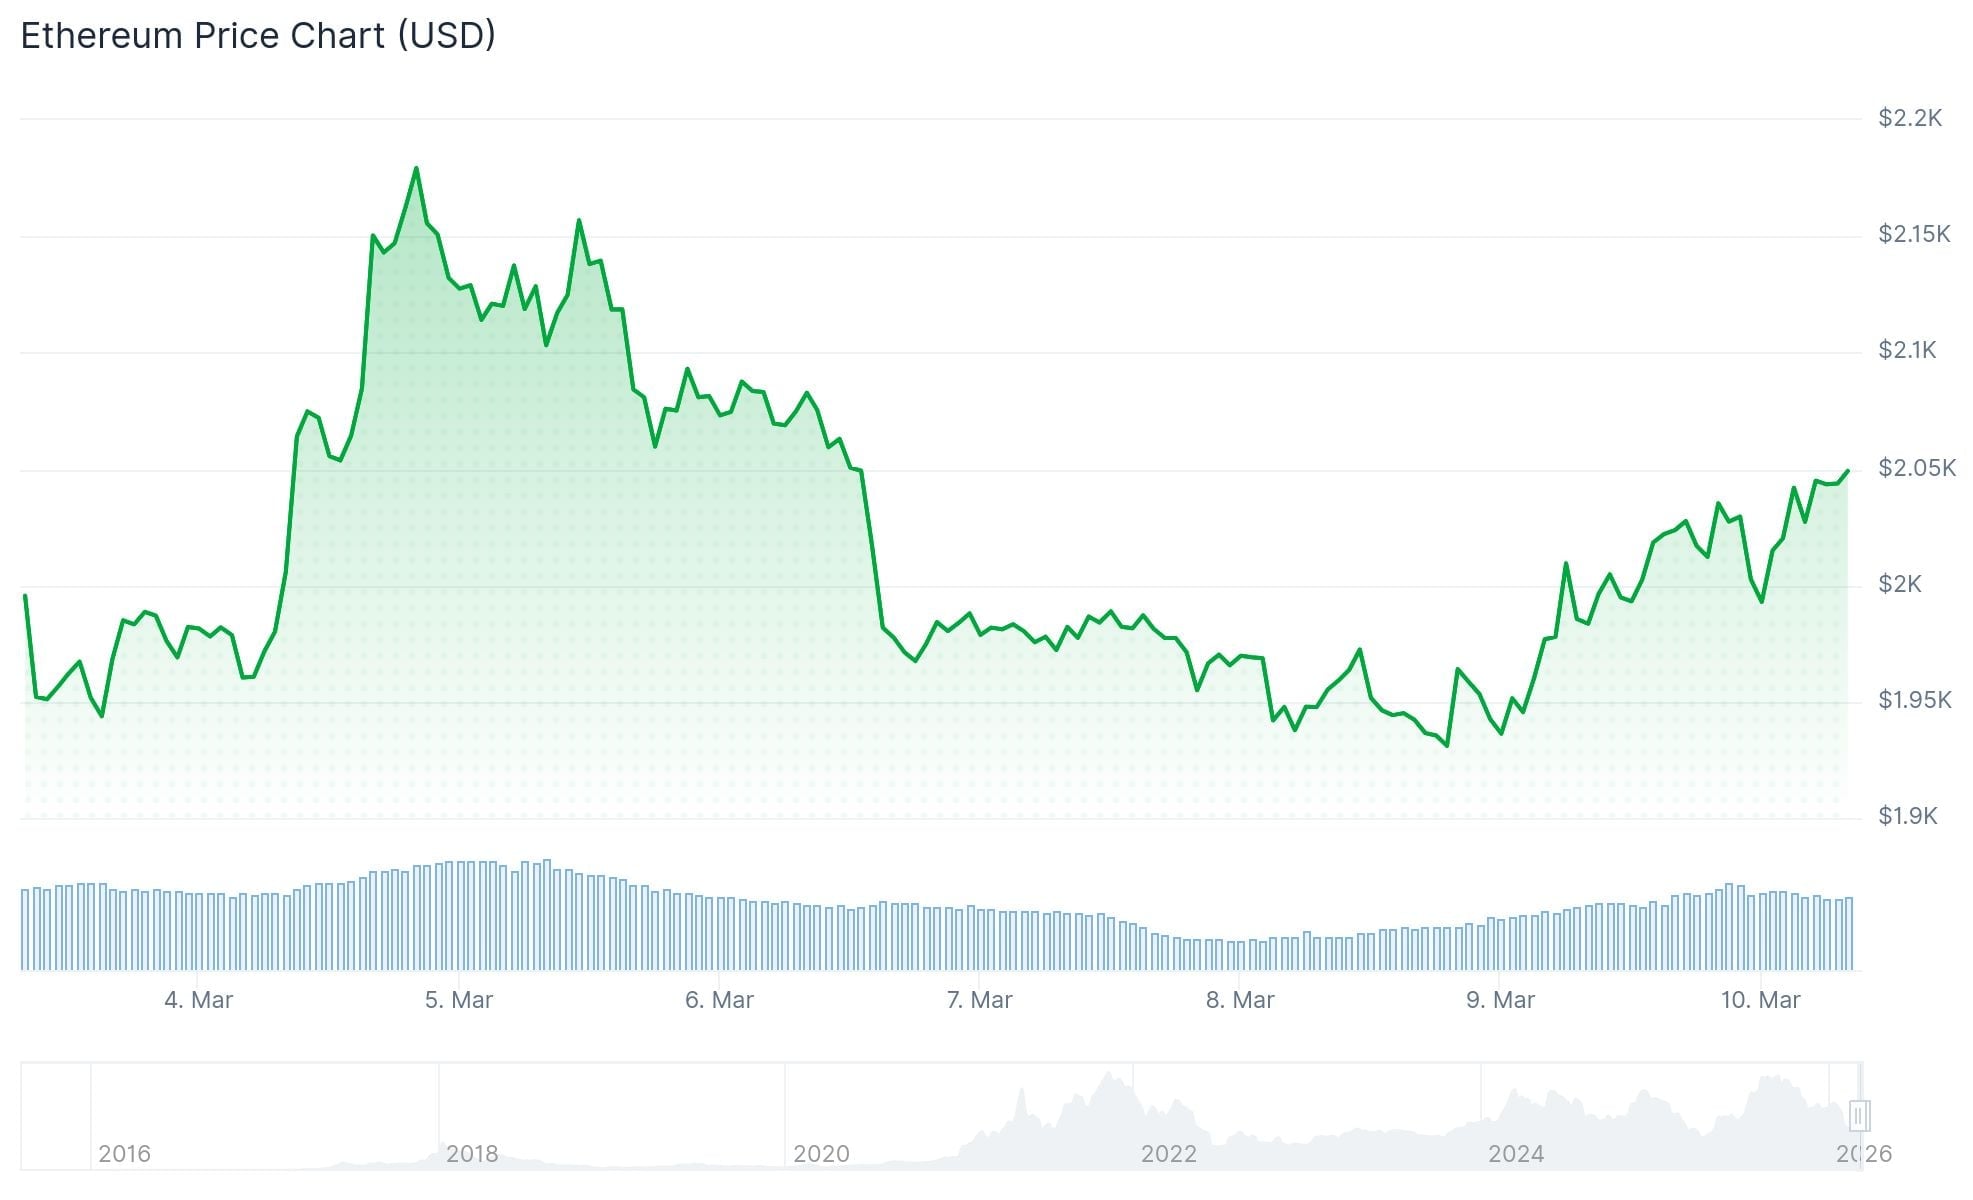
Ethereum is presently changing hands around $2,050 following a rebound from Sunday’s local bottom near $1,908. Last week saw the asset briefly challenge the $2,150 threshold before experiencing a pullback.
Derivatives market information from CryptoQuant reveals a net deposit of 110,343 ETH tokens flowing into derivative platforms on March 7. This marked the third-largest influx recorded in 2026.
A comparable surge occurred on February 6, immediately preceding a roughly 13% rally in ETH from its yearly floor of $1,736. This historical parallel provides useful context for interpreting current market positioning.
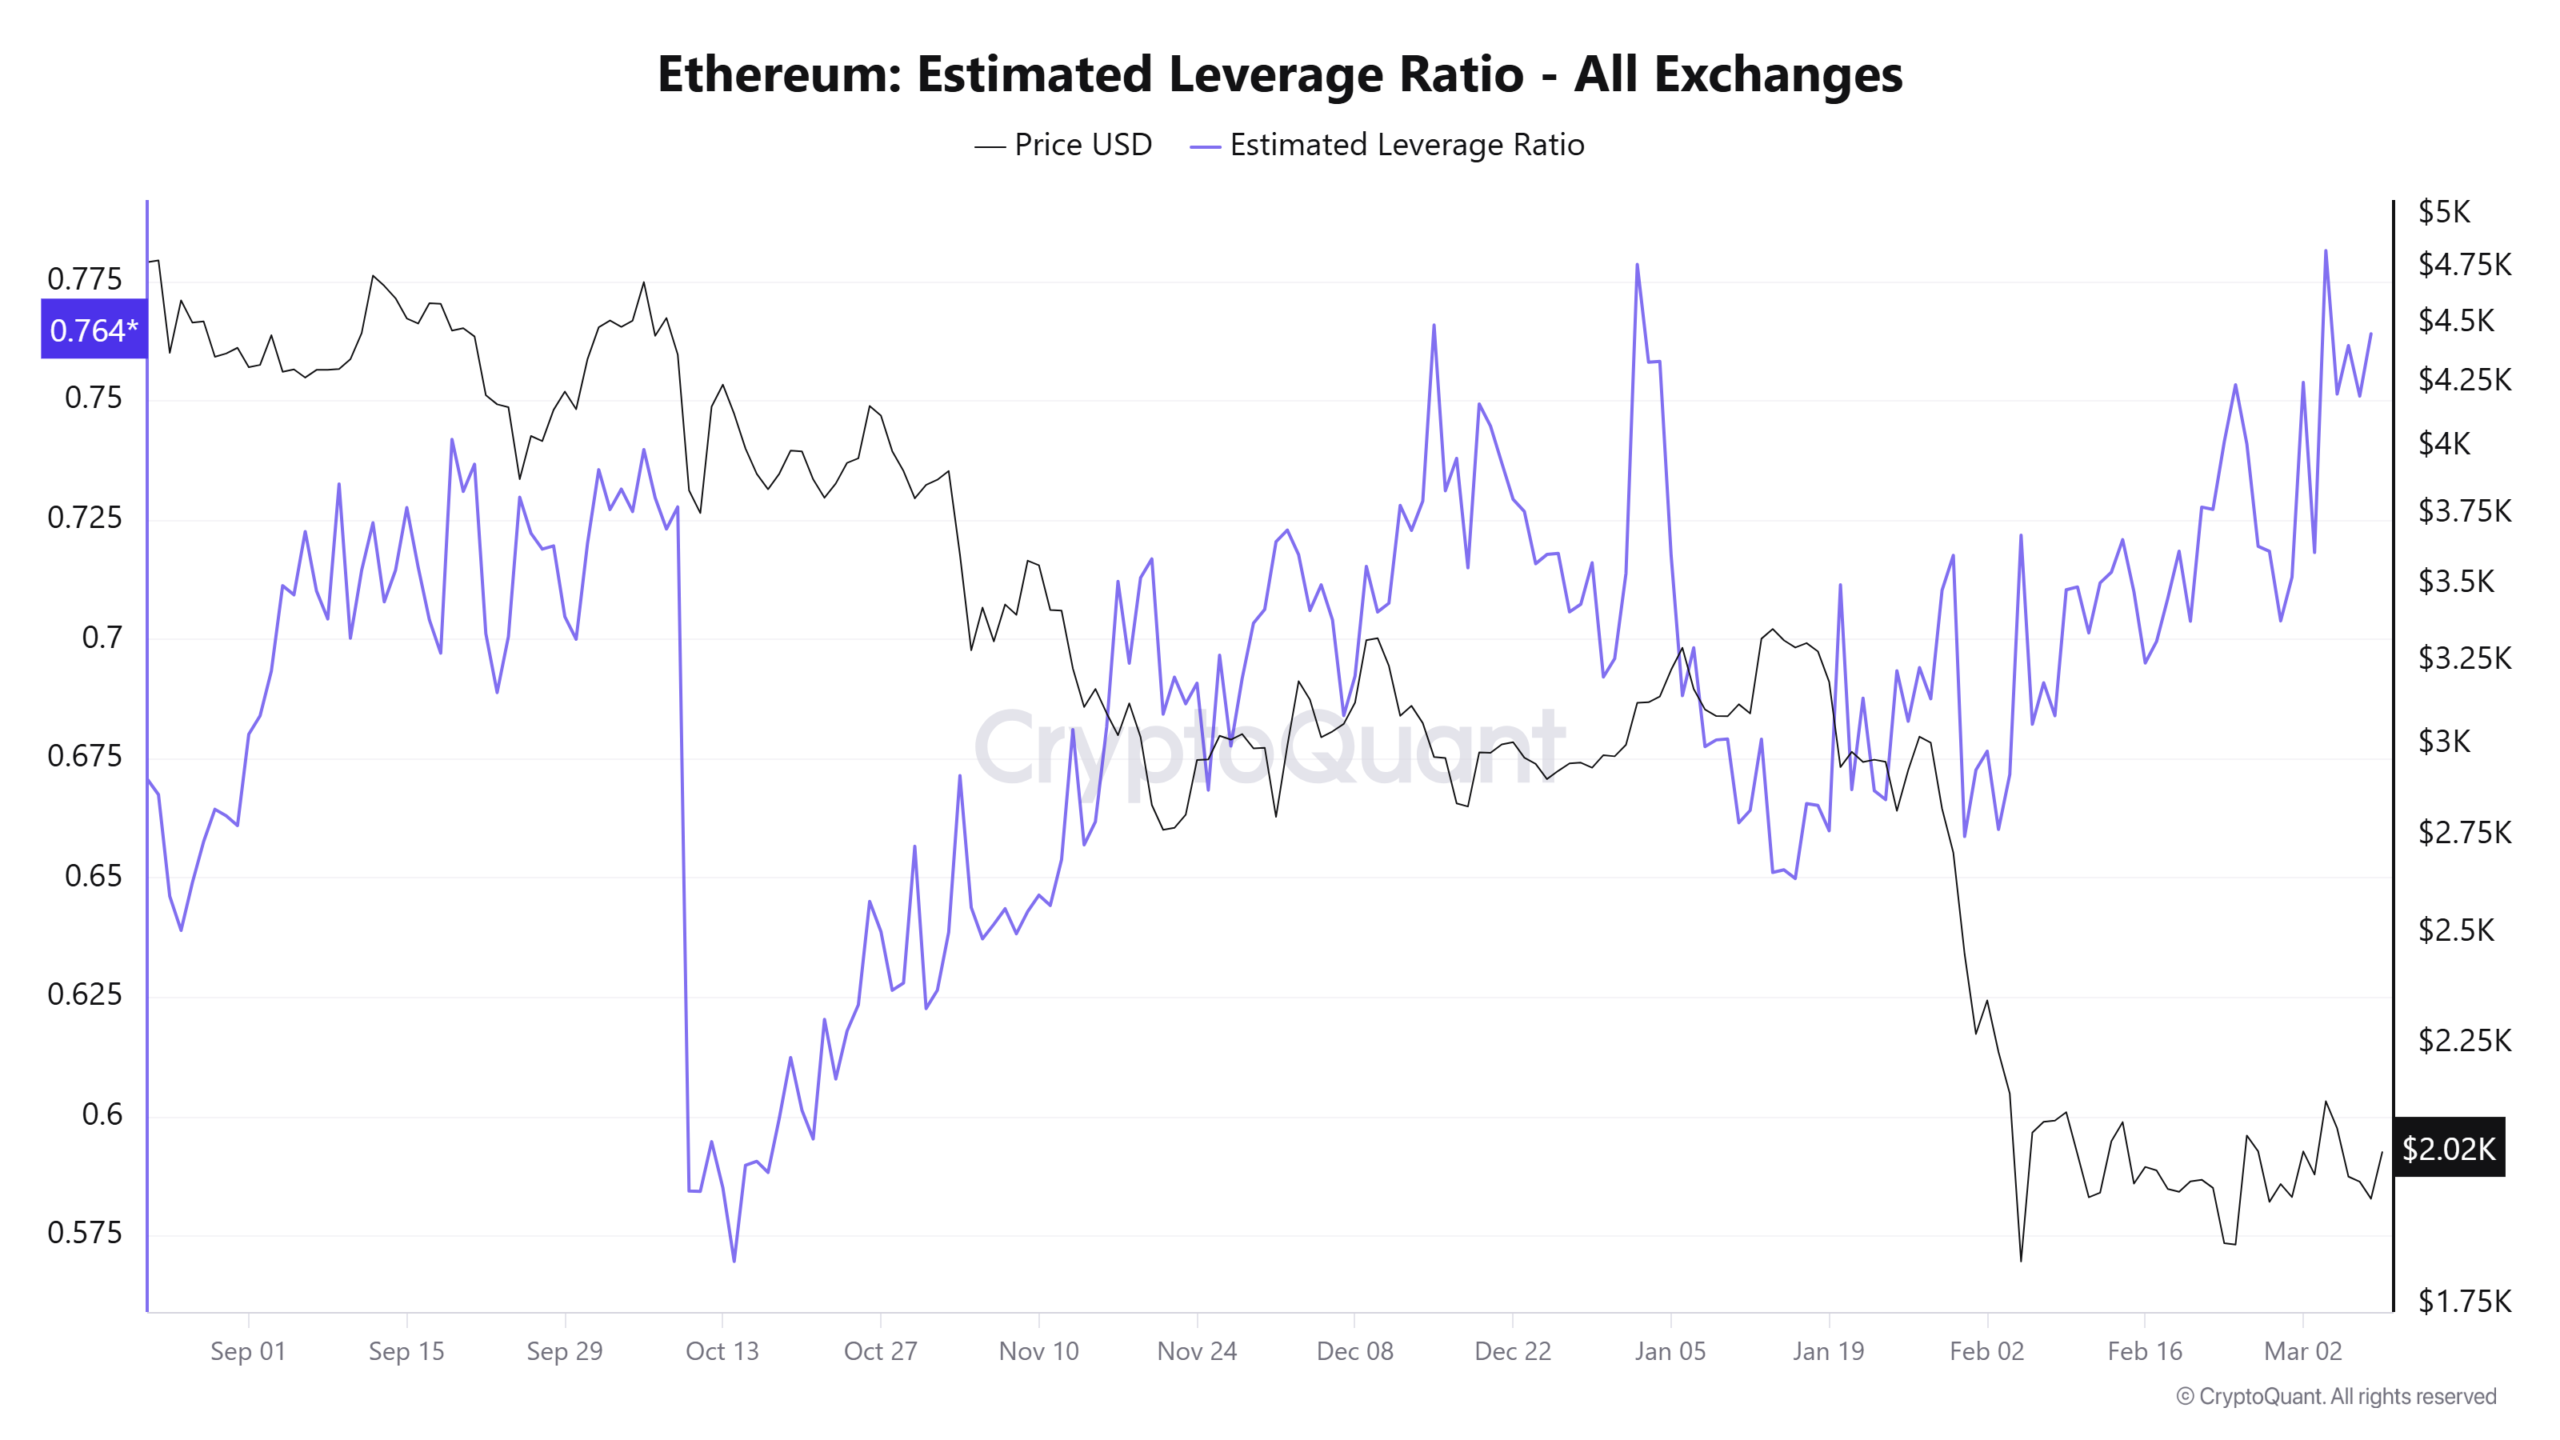
The estimated leverage ratio for Ethereum surged to an all-time high of 0.78 during the current week. This surpasses the prior record of 0.778 established on January 1.

This metric calculates the relationship between open interest and exchange reserves. Elevated readings indicate greater reliance on borrowed capital among market participants, which amplifies potential price volatility in both directions.
Cascading Short Liquidations May Trigger Upward Momentum
According to CoinGlass analytics, approximately $273 million in bearish position liquidation leverage is concentrated around the $2,030 price point. Such accumulations frequently serve as magnetic price targets.
Should ETH advance into this territory, automatic buy orders from liquidated short positions could rapidly accelerate upward momentum. Market observers characterize this phenomenon as a “liquidity sweep.”
Cryptocurrency analyst Cyril-DeFi observed that ETH is simultaneously testing a multi-year ascending trendline that has provided support since the previous market cycle. The analyst identified the $1,900–$2,000 region as a pivotal zone that may determine the subsequent directional move.
Technical Indicators Paint an Important Picture
The weekly Relative Strength Index currently registers 33, positioned marginally above the oversold threshold of 30. Historical analysis indicates that readings within this range have frequently preceded significant rebounds or accumulation phases.
The Fear & Greed Index presently stands at 13 out of 100, indicating “Extreme Fear.” Such sentiment extremes have occasionally preceded market reversals.
Daily chart analysis reveals Ethereum oscillating between the $1,930 and $2,050 boundaries. Neither directional breakout has materialized with conviction.
A confirmed daily close exceeding $2,120 would negate the current bearish configuration and potentially propel prices toward the $2,200–$2,350 corridor. The 20-day exponential moving average is positioned near $2,120.
Conversely, if the $1,930 support fails, technical analysts highlight $1,760 as the subsequent probable destination, with $1,470 representing a more substantial support level established in April 2025.
ETH recorded $22.4 billion in 24-hour trading volume. Selling pressure has moderated, though aggressive accumulation from buyers remains absent.
Recent price behavior demonstrates ETH maintaining position above the $2,000 threshold with a bullish pivot structure emerging on the one-hour timeframe subsequent to Sunday’s liquidity hunt near $1,908.
Get 3 Free Stock Ebooks
Discover top-performing stocks in AI, Crypto, and Technology with expert analysis.
- Top 10 AI Stocks - Leading AI companies
- Top 10 Crypto Stocks - Blockchain leaders
- Top 10 Tech Stocks - Tech giants


