
 Price Analysis: Chart Pattern Hints at Potential 50% Surge Ahead")
Key Takeaways
- XRP currently fluctuates between $1.36 and $1.39, maintaining ground above crucial $1.33 support level
- Technical analysis reveals symmetrical triangle formation with potential upside target of $2.06
- Investment products tracking XRP experienced $30 million in capital withdrawals during the previous week
- XRPL’s stablecoin supply expanded 2.5% in the last seven days, reaching $426 million
- Critical resistance zone identified at $1.42, with additional barriers at $1.53 and $1.75–$1.80
As of March 10, 2026, XRP is changing hands around $1.37, showing resilience after a recent decline to $1.34. The digital asset experienced a roughly 8% pullback from its weekly peak of $1.46 before staging a recovery.
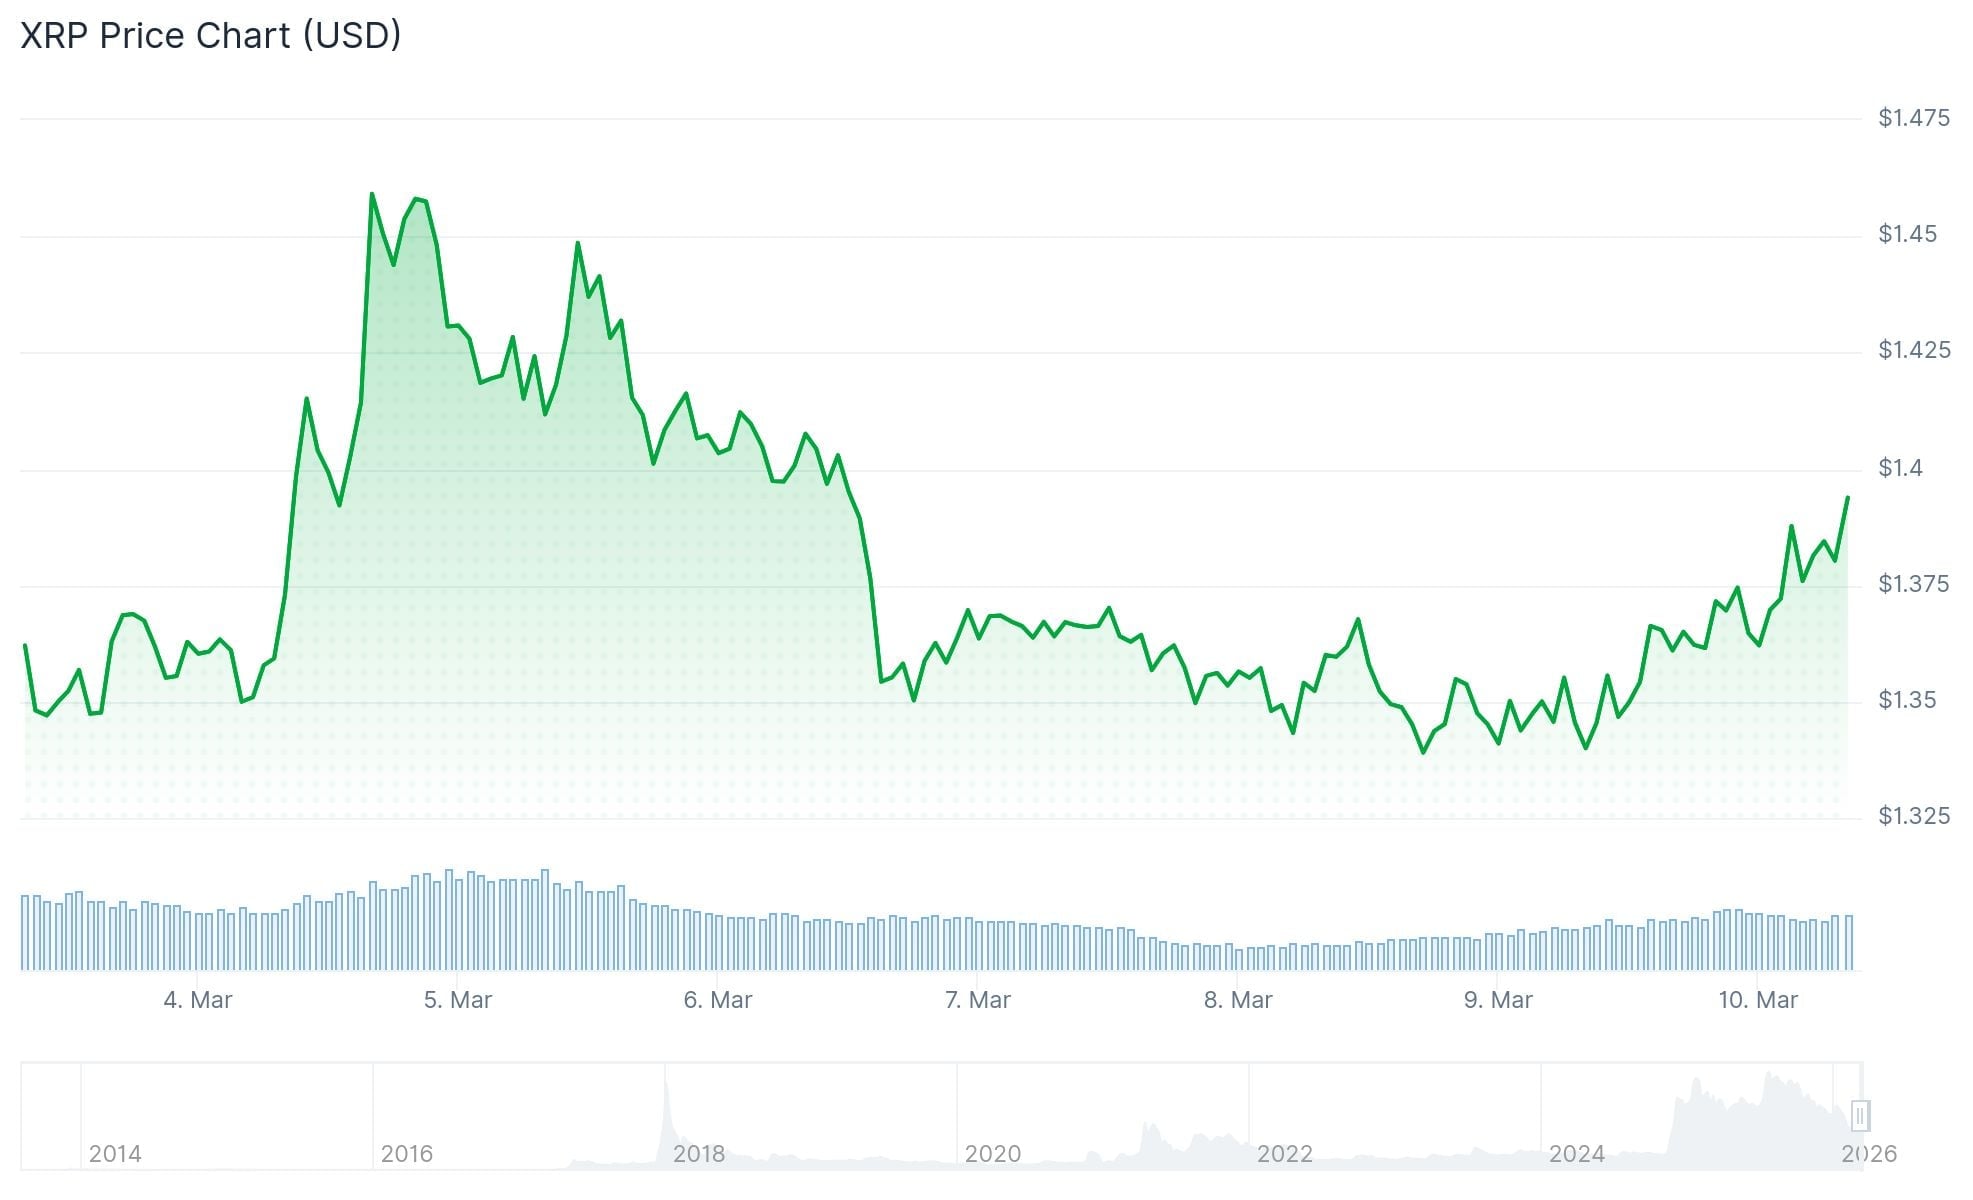
The downturn coincided with Bitcoin’s retreat amid inflation anxieties and escalating geopolitical tensions across the Middle East region. On March 10, XRP demonstrated strength with a nearly 4% climb, reaching an intraday peak of $1.39 during Asian market sessions.
Since reaching an all-time high of $3.66 in July, XRP has entered a corrective trajectory. Weekly chart analysis reveals a pattern of declining peaks and troughs, indicating near-term bearish momentum.
However, the diminishing size of recent candlesticks suggests the asset is entering a consolidation period rather than experiencing a sustained selloff.
Technical Formation Emerges on Daily Timeframe
XRP’s daily chart displays a developing symmetrical triangle configuration. This technical setup occurs when price action compresses between two converging trendlines that connect successive highs and lows.

A decisive move above the triangle’s upper boundary would signal bullish continuation. Market technicians are closely monitoring the 23.6% Fibonacci retracement at $1.42 as the initial resistance barrier that needs to be overcome.
Should XRP successfully breach $1.42, the triangle pattern’s measured move projects a price objective around $2.06. This represents approximately a 50% advance from present levels.
Technical oscillators are providing encouraging signals. The MACD histogram shows upward momentum, while the RSI has created a bullish divergence against recent price action—both indicating diminishing downside pressure.
On March 9, market analyst JD highlighted that XRP continues to respect a long-term ascending trendline dating back to early accumulation phases below $0.01. Historical data shows each retest of this trendline has consistently drawn buyer interest.
For longer-term bulls, the $3.30–$3.50 zone represents a formidable resistance area. This region can be interpreted either as an ascending triangle top or rising wedge resistance, depending on technical perspective.
Investment Flows and Network Metrics
CoinShares data reveals that XRP-focused investment vehicles recorded $30 million in outflows during the previous week. Despite this, total assets under management remain substantial at approximately $2.4 billion, with year-to-date inflows maintaining a positive $123 million.
US-listed spot XRP ETFs witnessed $22 million in net redemptions across the last two weeks, breaking a four-week streak of positive inflows.
Futures Open Interest currently stands at $2.25 billion, representing a significant decline from the July high of $10.94 billion.
Conversely, on-chain metrics paint a more optimistic picture. DeFiLlama reports that stablecoin supply on the XRP Ledger increased 2.5% during the past week, now totaling $426 million. Rising stablecoin balances generally indicate expanding liquidity and heightened trading activity within the ecosystem.
Near-term support rests at $1.33. A breakdown below this level could expose $1.27 as the next downside target. Conversely, upside obstacles are positioned at $1.42, $1.53, and the $1.75–$1.80 range.
Get 3 Free Stock Ebooks
Discover top-performing stocks in AI, Crypto, and Technology with expert analysis.
- Top 10 AI Stocks - Leading AI companies
- Top 10 Crypto Stocks - Blockchain leaders
- Top 10 Tech Stocks - Tech giants


