
 Price Struggles Below $2,200 Amid Macro Headwinds and ETF Outflows")
Key Takeaways
- Ethereum declined 6% following a failed attempt to sustain levels above $2,200, pressured by US stock market weakness and geopolitical tensions
- Options market skew reached 7%, indicating institutional traders are positioning for potential further declines
- US-based Ethereum spot ETFs experienced net outflows totaling $91 million on March 5
- The validator entry queue expanded to 3.4 million ETH, while the exit queue contracted to only 58,944 ETH
- The Ethereum ecosystem commands 65% of total blockchain TVL when layer-2 solutions are included, with the main chain holding $55.4B alone
Ethereum is currently hovering near $2,080 following an unsuccessful attempt to maintain momentum above the $2,200 mark earlier this week. The pullback occurred as investors grew more cautious amid escalating tensions involving Iran and a significant US court decision mandating the government to return over $130 billion in tariff payments to businesses.
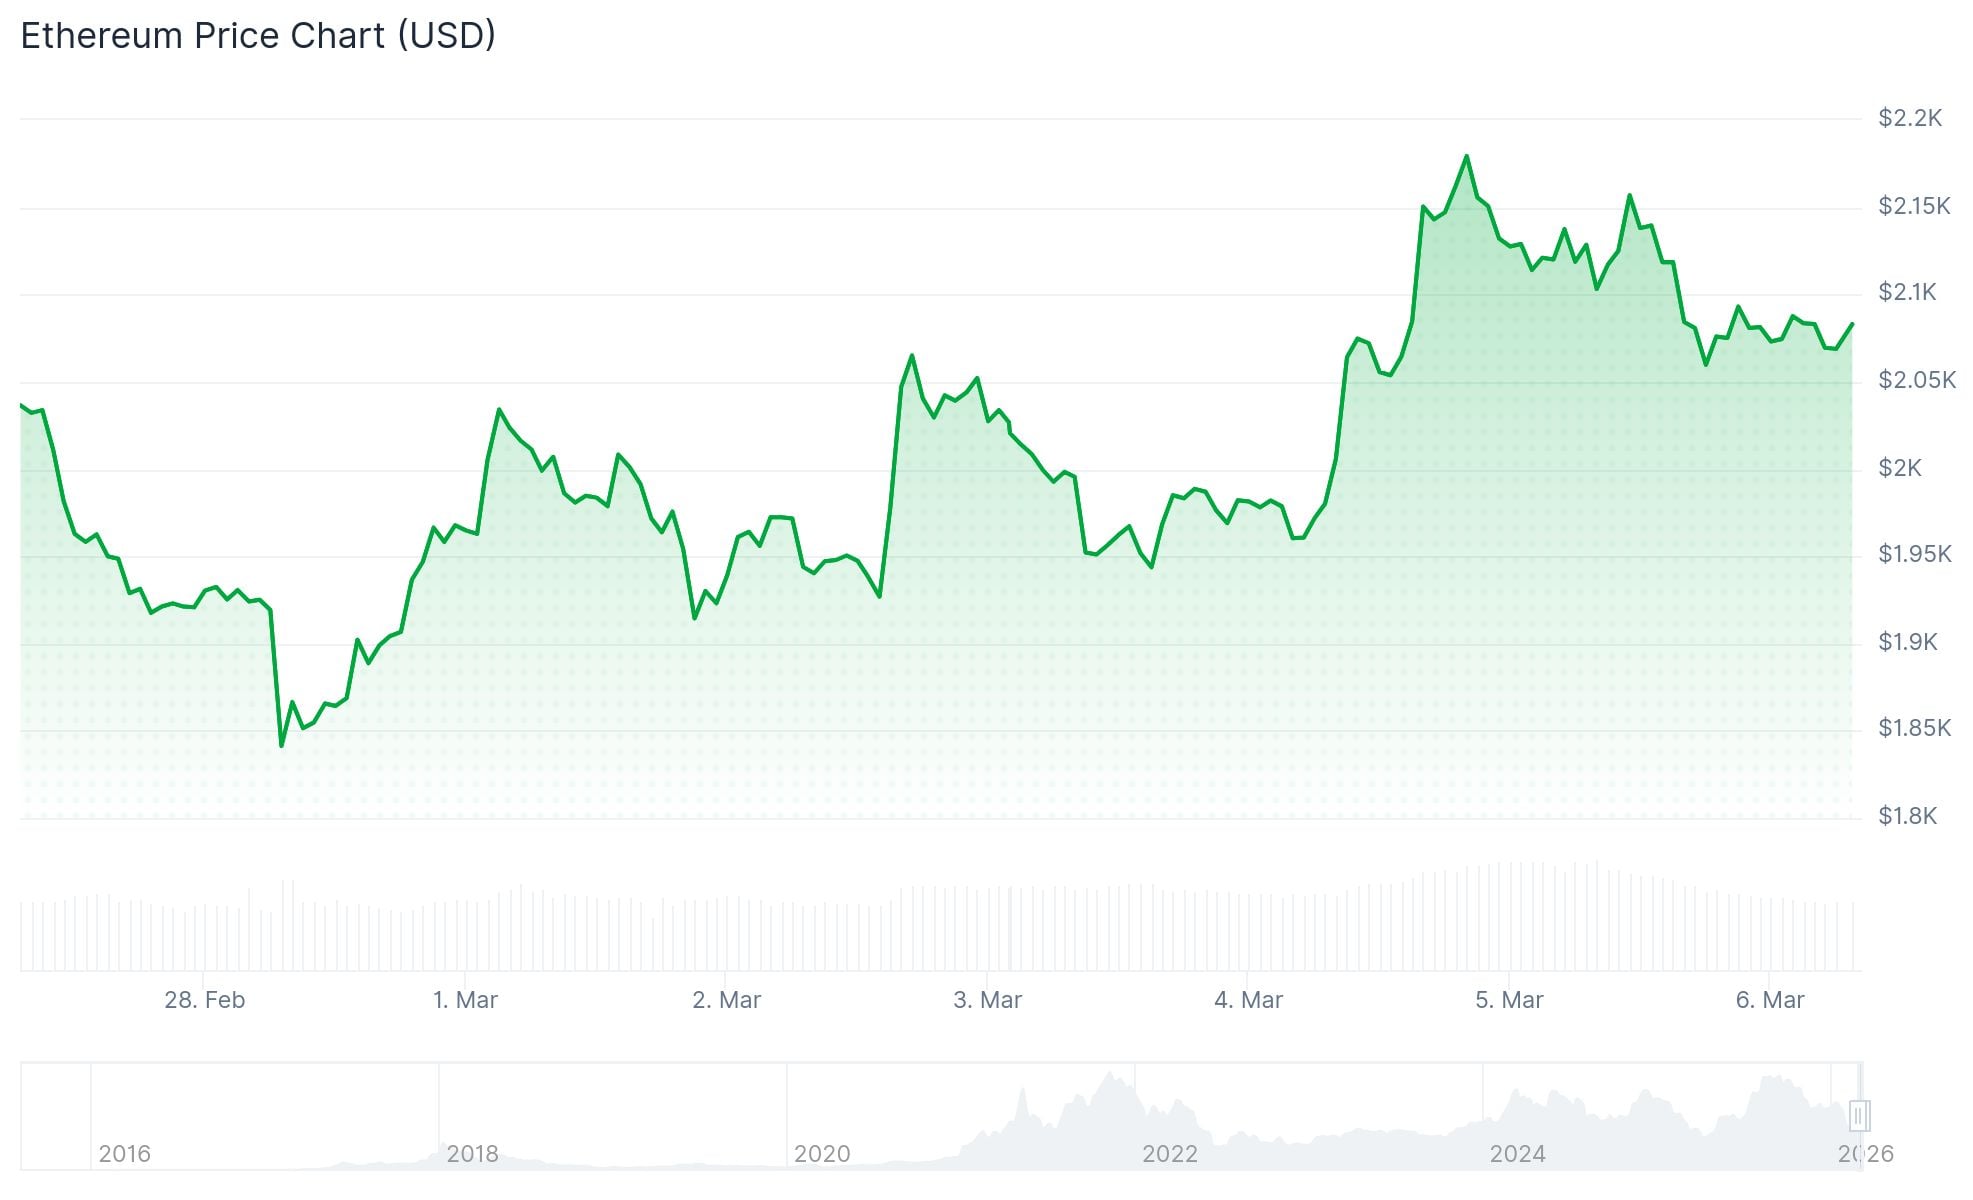
The second-largest cryptocurrency had climbed 22% from February’s $1,800 bottom, but the upward trajectory hit a wall. After briefly touching $2,200 on Wednesday, ETH tumbled 6%, tracking the decline in US stock markets.
Futures market indicators paint a bearish picture. The 30-day annualized premium on ETH futures remains significantly below 5%, the level considered neutral. This indicates limited appetite for leveraged long positions among derivatives traders.
The options market tells a similar story. ETH’s put-call skew expanded to 7% on Thursday. Readings above 6% typically signal that sophisticated market participants are purchasing downside protection in anticipation of further losses.
Liquidation data from CoinGlass reveals that $58 million in ETH positions were wiped out over a 24-hour period, with long positions accounting for $35.7 million of that total.

Institutional Flows and Staking Trends
The bearish price action coincided with negative ETF flows. March 5 saw US spot Ethereum ETFs post combined net outflows of $91 million, signaling reduced institutional demand for the day.
This marked a reversal from earlier in the week when inflows had been more robust, demonstrating how rapidly investor sentiment can pivot in response to changing market dynamics.
Meanwhile, the validator entry queue presents a contrasting narrative. It has ballooned to approximately 3.4 million ETH, while validators waiting to exit have dwindled to just 58,944 ETH. Prospective validators now face wait times extending to 57 days.
This data indicates that major stakeholders prefer to lock up their ETH for staking rewards rather than liquidating positions during periods of market turbulence.
On-Chain Metrics and Market Dominance
Decentralized exchange activity on Ethereum has cooled substantially. Weekly DEX volumes declined to $12.6 billion from $20.2 billion recorded a month prior. DApp revenue generation similarly slumped to $14.1 million over the past seven days, representing a 47% month-over-month decrease.
Solana experienced comparable challenges, with its DEX volumes dropping by 50% across the same 30-day timeframe.
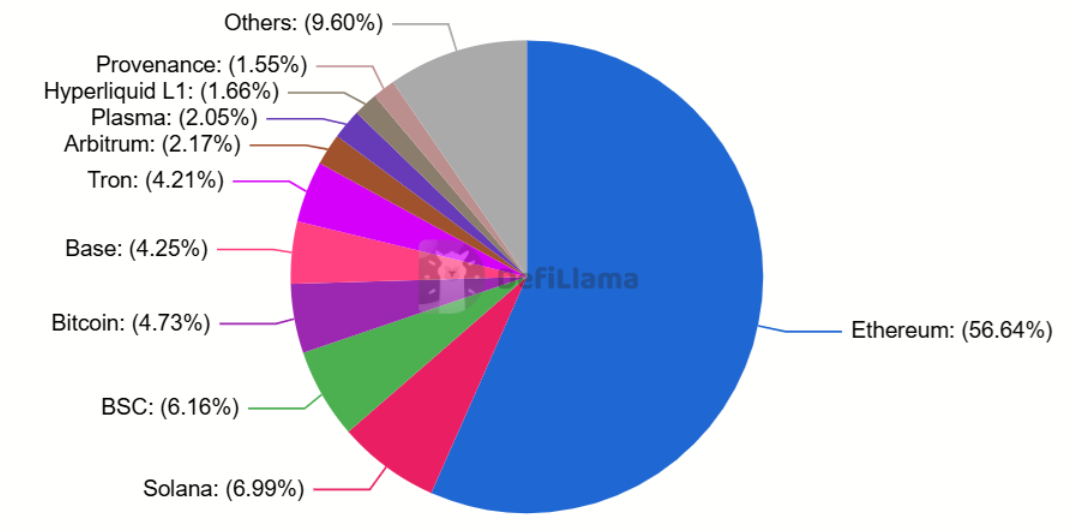
Despite the slowdown in network activity, Ethereum maintains its dominance in total value locked metrics. When factoring in layer-2 solutions, the Ethereum ecosystem captures approximately 65% of all blockchain TVL. The base layer independently secures $55.4 billion, dwarfing Solana’s $6.8 billion.
From a technical perspective, immediate resistance is positioned at $2,108 on the daily timeframe. A decisive break above this level could pave the way toward $2,388. Conversely, if the $1,741 support zone fails to hold, subsequent downside targets emerge at $1,524 and $1,404.
Based on current range structure, technical analysts have identified $1,826 as the lower support boundary and the likely destination if selling momentum intensifies in the near term.
Get 3 Free Stock Ebooks
Discover top-performing stocks in AI, Crypto, and Technology with expert analysis.
- Top 10 AI Stocks - Leading AI companies
- Top 10 Crypto Stocks - Blockchain leaders
- Top 10 Tech Stocks - Tech giants


