
 Price: Major Whales Loading Up During Consolidation – Breakout Imminent?")
TLDR
- Solana has maintained a narrow trading corridor between $78 and $90 for approximately four weeks, displaying classic accumulation behavior.
- On-chain transaction volumes surged 19.1% week-over-week, while trading activity expanded from $22B to $34B.
- SOL-focused spot ETFs attracted $18.44 million over a two-day period, following a prior week’s $44.44 million intake.
- Breaking decisively through the $90–$92 zone could trigger a move toward $100, with $137 (200-day EMA) as an extended target.
- Failure to hold $78 would likely result in a retest of the $67 support zone.
For roughly 30 days, Solana has been locked in a sideways pattern, oscillating between $78 support and $90 resistance. The market remains indecisive, with neither buying nor selling pressure gaining a decisive edge.
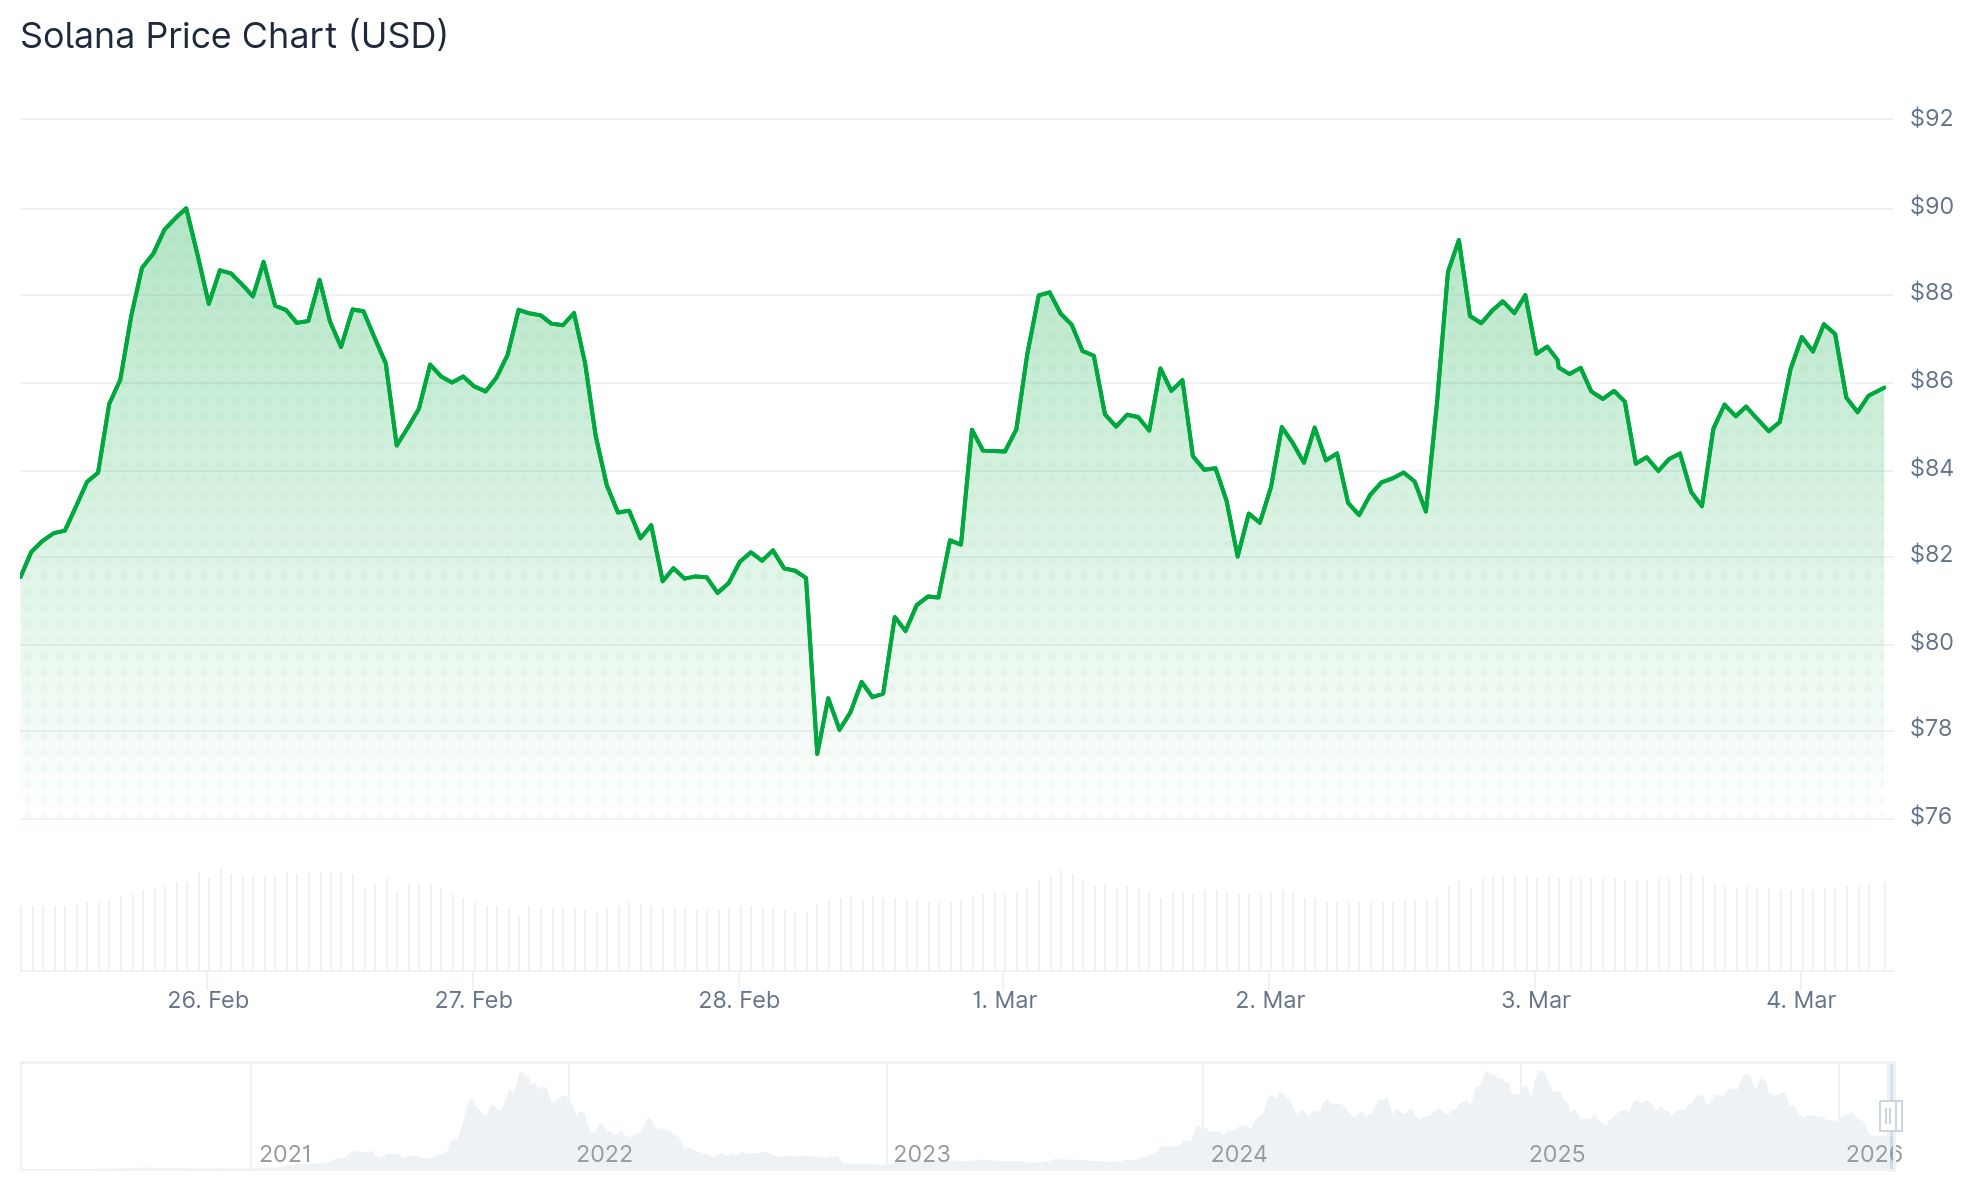
Large holders have been strategically positioned throughout this range — accumulating near the lower boundary and distributing near the upper limit. This tug-of-war has characterized price action since mid-February.
On February 12, SOL defended the $78 level and rallied back to $90 in just three trading sessions. An identical scenario unfolded on February 24.
Currently, SOL is hovering around $85 after approaching $88 before encountering mild selling pressure.
The asset remains capped below the parallel channel’s upper trendline at $87.96, which continues to serve as near-term resistance.

Network Metrics Show Growing Engagement
Blockchain analytics from Artemis reveal that weekly transaction counts expanded from 764 million to 910 million — representing a substantial 19.1% weekly gain.
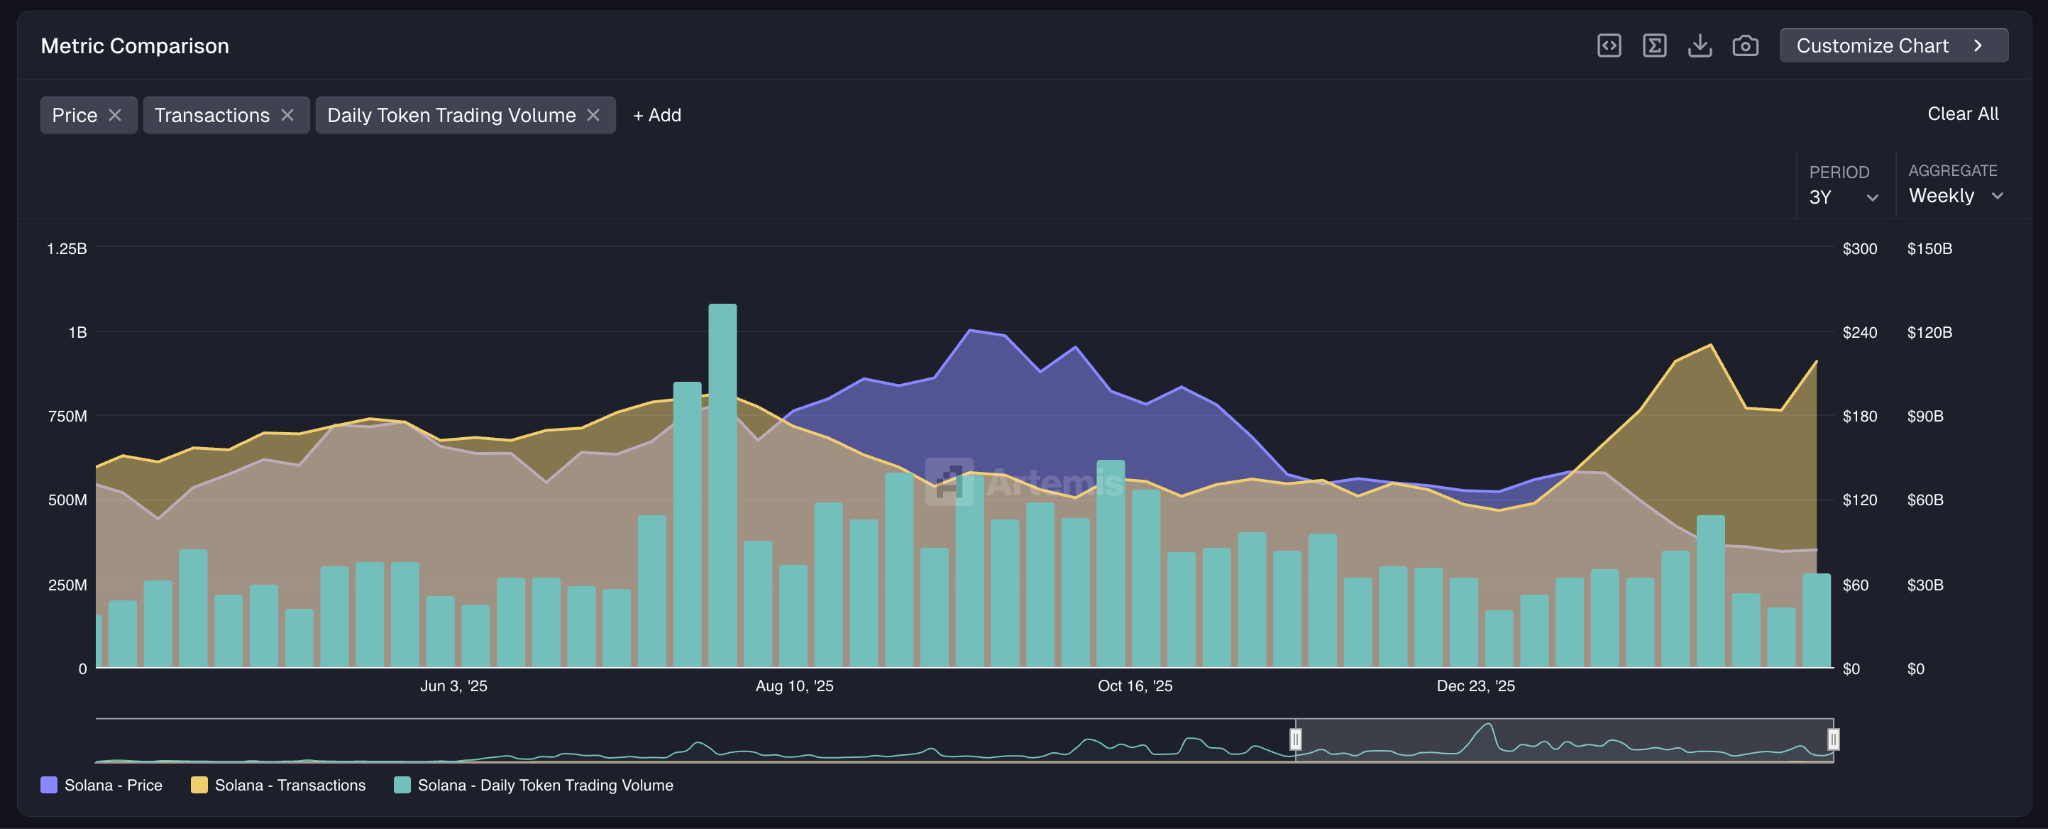
Concurrently, weekly active addresses climbed, approaching peak 2026 levels for this indicator.
SOL’s trading volume expanded dramatically from $22 billion to $34 billion within seven days, signaling heightened market participation as price repeatedly validates the $78 support zone.
Institutional Capital Flows Accelerate Through ETFs
Solana spot ETFs registered $1.03 million in net inflows on Tuesday, building on the previous day’s $17.41 million — combining for $18.44 million across two sessions.
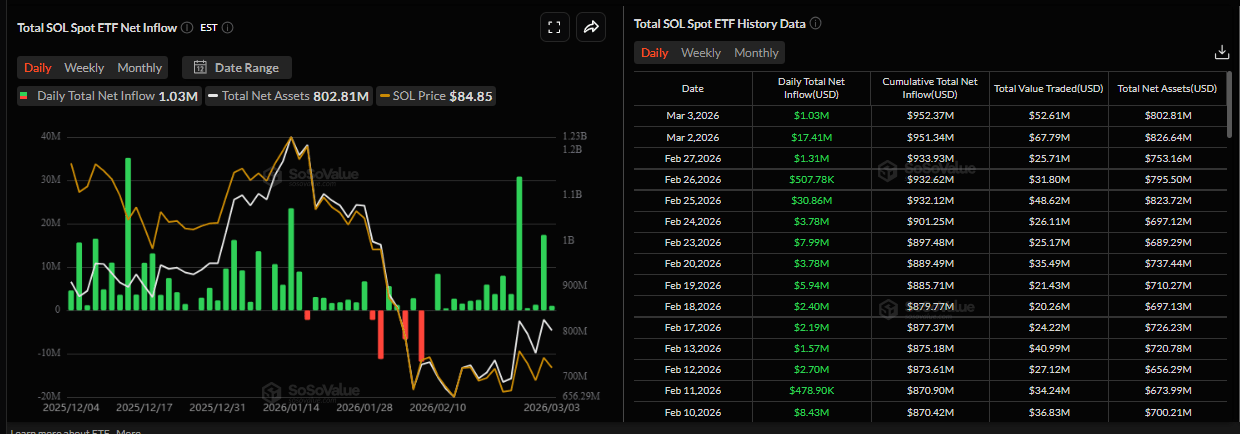
The preceding week delivered $44.44 million in ETF accumulation, marking the strongest seven-day period since mid-January.
Perpetual futures funding rates shifted into positive territory Wednesday at 0.0008%, indicating growing optimism among leveraged traders.
The daily Relative Strength Index has rebounded into the mid-40s after touching oversold conditions, while the MACD maintains bullish momentum above the signal line.
Immediate overhead resistance aligns with the 23.6% Fibonacci retracement at $86.60, with the next meaningful barrier at $98.42 (38.2% Fib) coinciding with the 50-day exponential moving average.
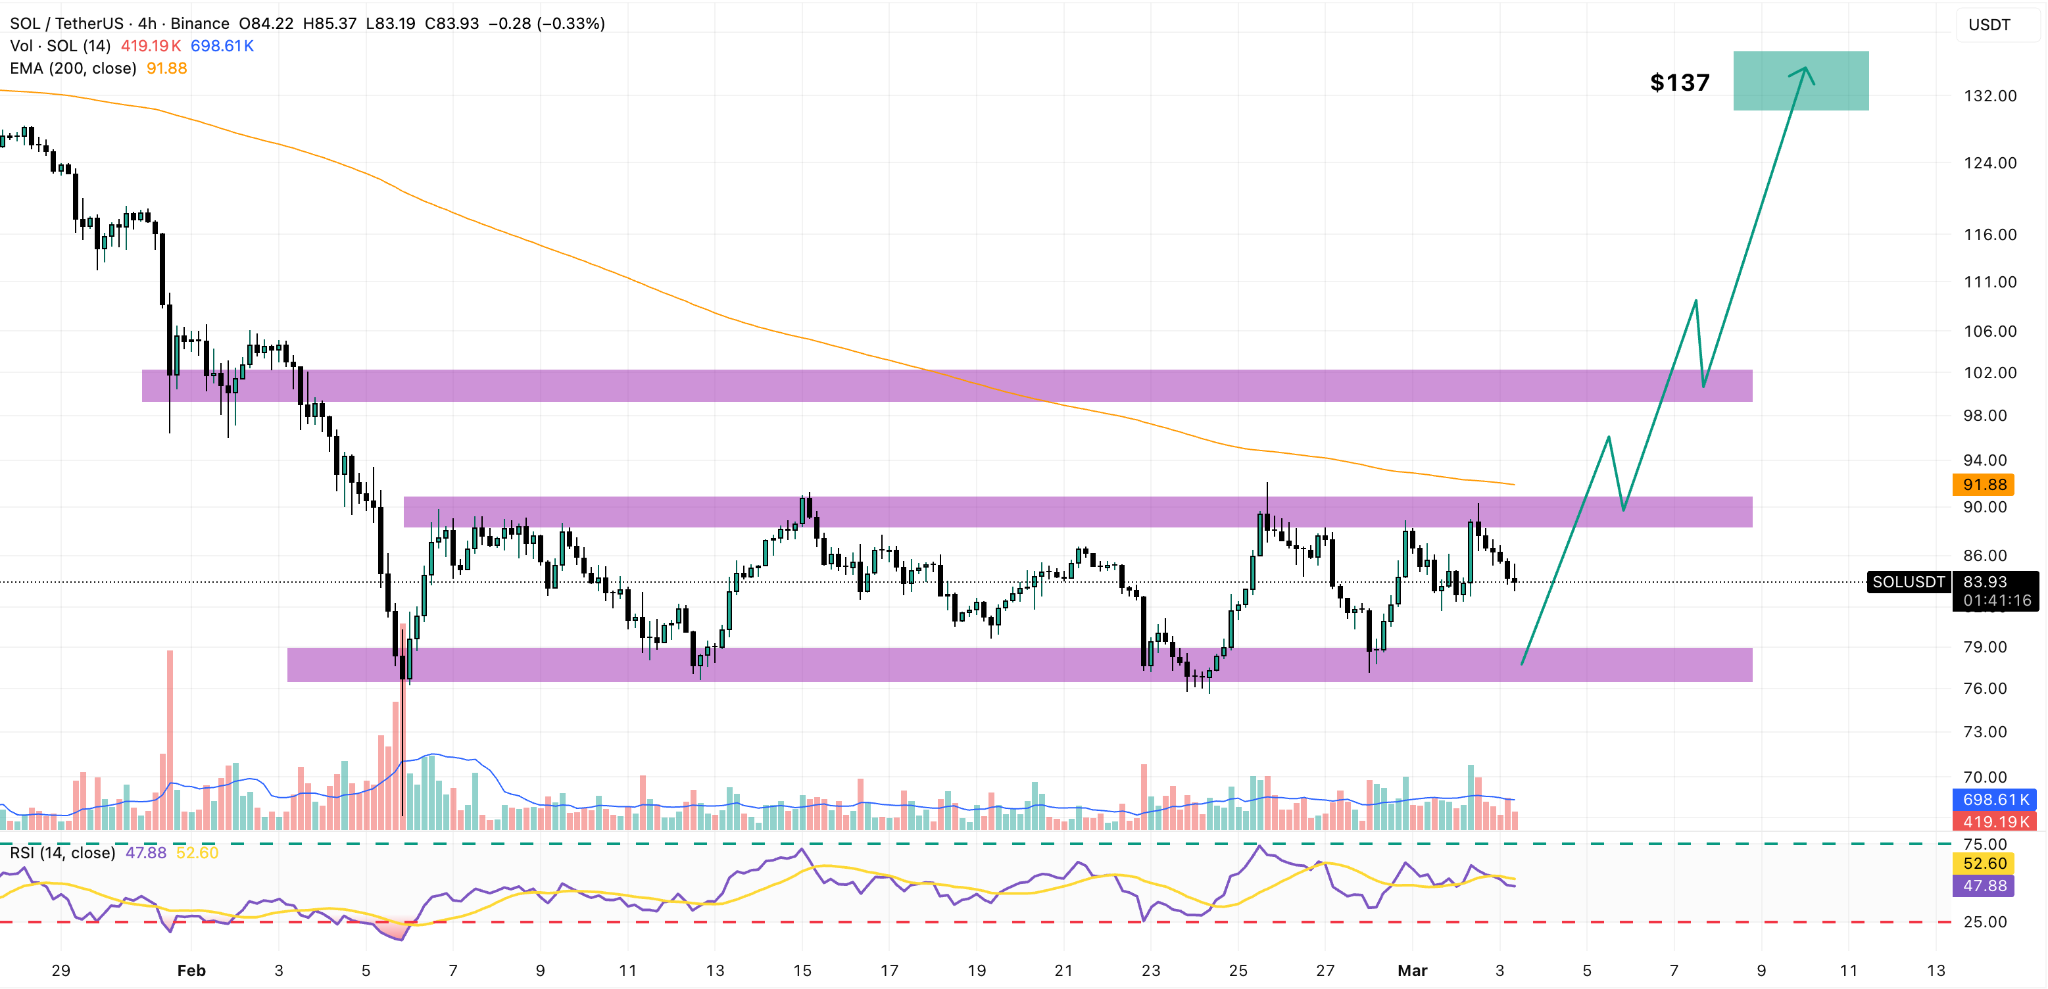
A sustained close above $92 would likely accelerate momentum toward $106, and clearing that hurdle could quickly bring $120 into focus.
The 200-period daily EMA currently resides at $137 — representing a potential 63% appreciation from current valuation if Solana can establish a confirmed breakout.
Downside risk begins at $77.60, with additional support identified at the previous swing low of $67.50.
Market analysts consider $80 a pivotal level — a breakdown here would probably drive SOL toward $75 or even $70.
Two distinct buy signals on the hourly timeframe both activated near $78 and successfully reached the $90 objective, delivering returns of 4.4x and 2.3x risk-reward ratios.
Over the trailing seven-day period, SOL has advanced 9.3%, establishing itself as the strongest performer among the top five cryptocurrencies by market capitalization during this timeframe.
Get 3 Free Stock Ebooks
Discover top-performing stocks in AI, Crypto, and Technology with expert analysis.
- Top 10 AI Stocks - Leading AI companies
- Top 10 Crypto Stocks - Blockchain leaders
- Top 10 Tech Stocks - Tech giants


