
 Price: Large Holders Accumulate 320K Tokens While Network Usage Reaches Decade Peak")
Key Highlights
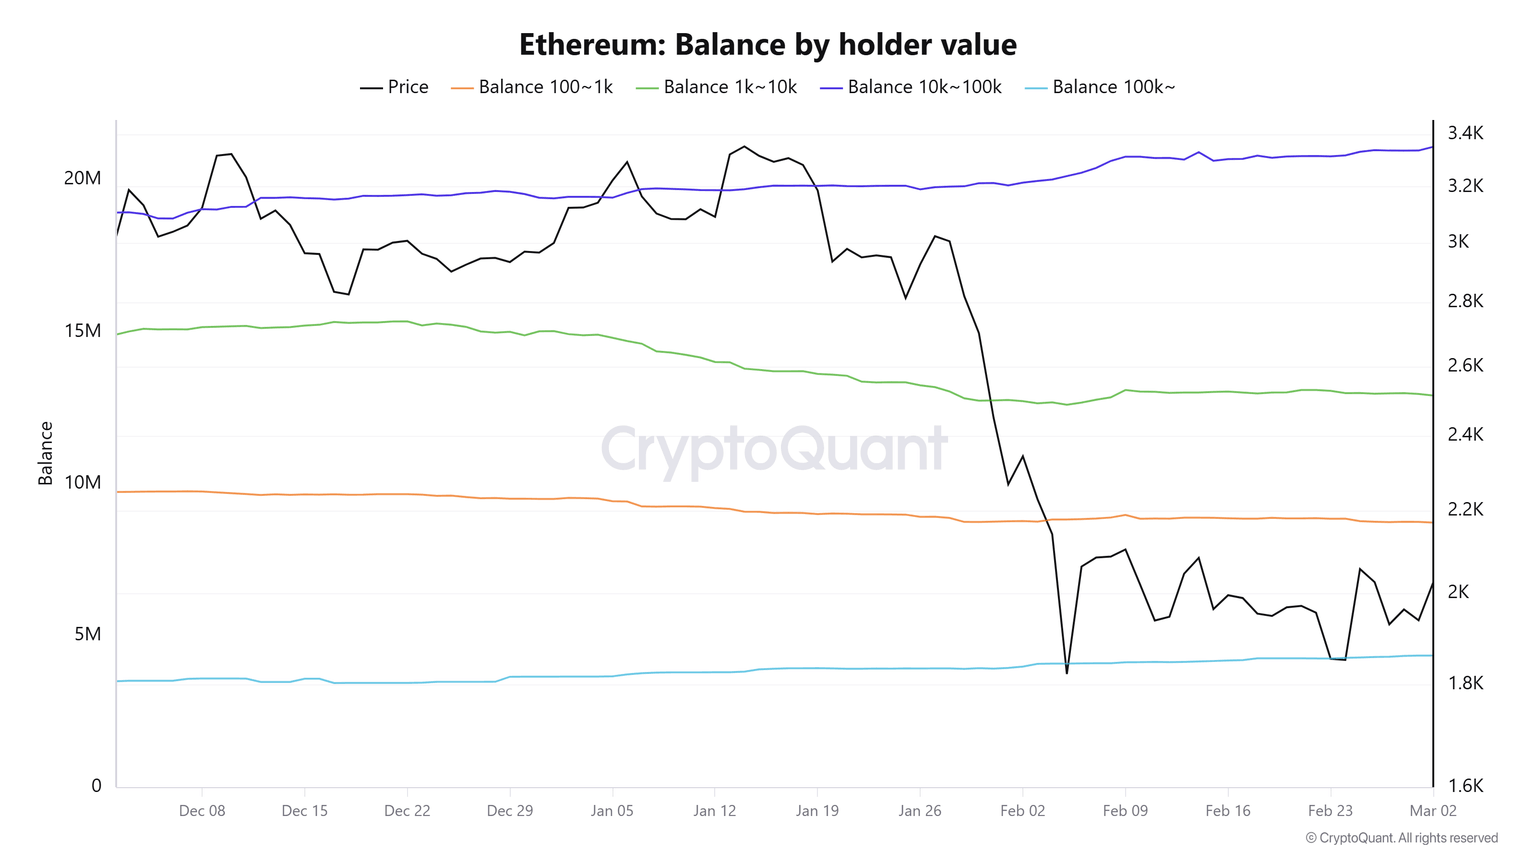
- Large Ethereum holders accumulated 320K ETH during the past week while smaller investors offloaded 210K ETH
- Daily active addresses reached 837,200, marking a 10-year peak for network engagement
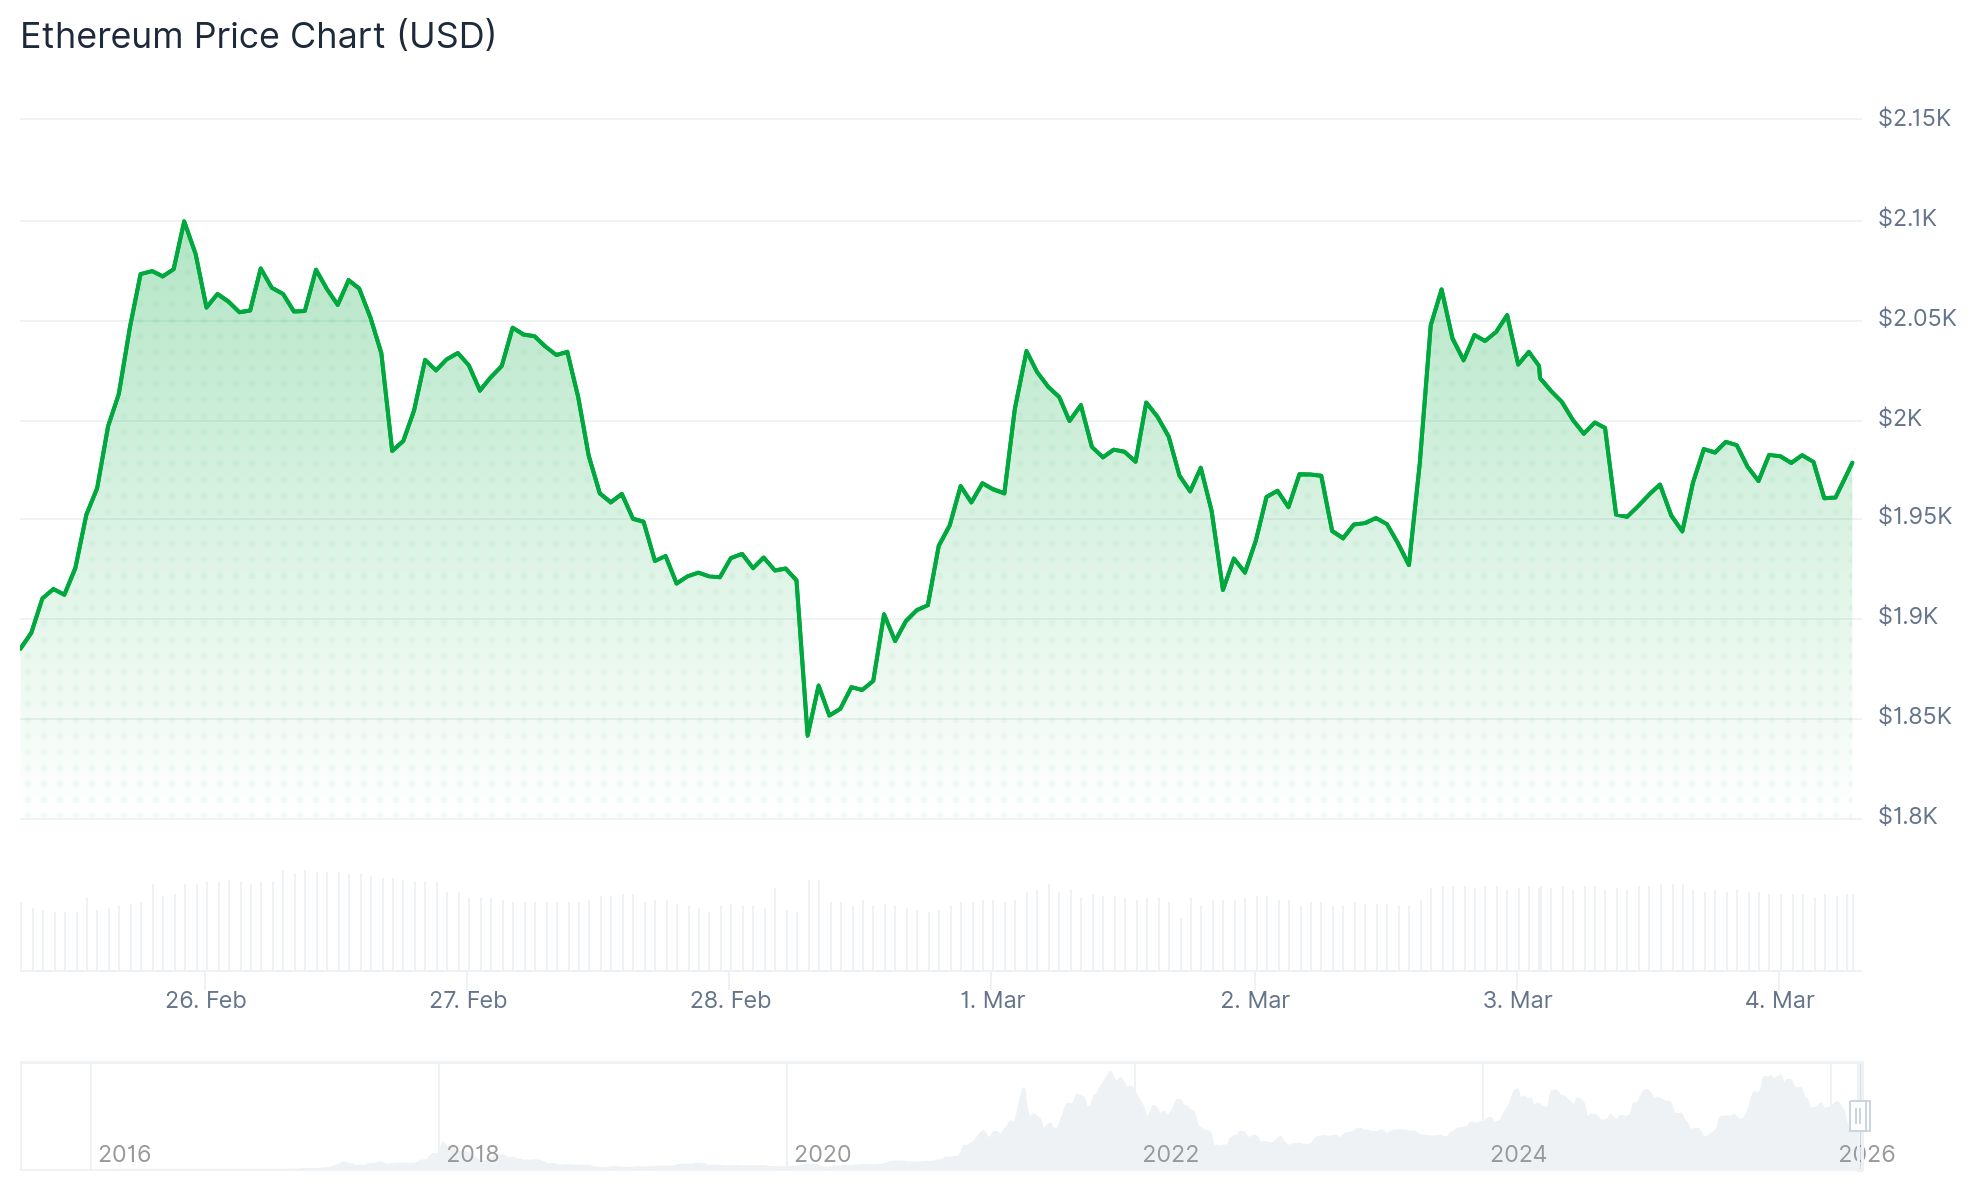
- ETH price remains range-bound between $1,980–$1,990, facing resistance at the $2,000 threshold
- Spot Ethereum ETFs in the United States recorded $38.6 million in net inflows on Monday
- Bearish positioning on Binance has declined significantly, though ETH trades below critical averages
Ethereum continues trading around $1,980, facing difficulty breaking through the critical $2,000 resistance level even as major holders increase their positions and network engagement reaches historic levels.
During the previous seven days, addresses containing between 10,000 and 100,000 ETH accumulated 120,000 tokens just on Sunday and Monday. Aggregate whale accumulation throughout the week totaled 320,000 ETH. Conversely, retail-sized addresses holding between 100 and 10,000 ETH distributed approximately 210,000 ETH during this period.
American market participants have demonstrated stable sentiment. The Coinbase Premium Index, which measures purchasing pressure from US-based buyers, remained positive throughout the period. Spot Ethereum ETFs in the United States also reversed course on Monday, attracting $38.6 million in fresh capital with zero redemptions across all nine available products.
On the Binance exchange, short position dominance in ETH perpetual futures has decreased substantially throughout the week. This reduction indicates declining conviction among traders anticipating further price declines.
Network Engagement Reaches Decade Milestone
Data from Santiment reveals that Ethereum’s daily active address metric climbed to 837,200, representing the highest level in ten years. This figure reflects an 82% increase compared to five years prior and exceeds 1,100% growth versus ten years ago.

Daily new wallet creation has similarly increased 64% over the past five-year period, currently hovering around 284,800 fresh addresses daily. Historical patterns indicate that simultaneous increases in these on-chain indicators have typically preceded extended bullish cycles for ETH.
Despite these fundamental improvements, price action has not yet reflected this activity. ETH continues trading significantly below its 50-day exponential moving average near $2,300 and its 200-day exponential moving average positioned near $2,945.
Critical Price Zones
Ethereum experienced $78.3 million in forced liquidations during the past 24-hour period. Long positions accounted for $48 million of these liquidations.
The Relative Strength Index currently registers around 43, indicating subdued momentum without reaching oversold territory. Immediate resistance zones appear at $2,020, $2,050, and $2,080. A decisive move above $2,120 would likely target the $2,200 level.
Regarding downside risk, immediate support exists near $1,960, followed by $1,932. A breakdown beneath $1,895 could accelerate selling toward $1,850 or potentially $1,820.
Glassnode analytics indicate substantial accumulation occurred around $1,800, with approximately 1.23 million ETH acquired at an average entry price of $1,890 during the past month.
CoinGlass liquidation heat maps show concentrated long position vulnerability between $1,900 and $1,950. Short squeeze potential intensifies above the $2,000 level.
ETH’s current valuation near $1,990 positions the asset directly within this narrow volatility zone.
Get 3 Free Stock Ebooks
Discover top-performing stocks in AI, Crypto, and Technology with expert analysis.
- Top 10 AI Stocks - Leading AI companies
- Top 10 Crypto Stocks - Blockchain leaders
- Top 10 Tech Stocks - Tech giants


