
 Surges Past $2,150: Analyzing Short Squeeze, Volatility Spike and ETF Trends")
TLDR
- Ethereum surged to $2,150 this week before encountering technical resistance across multiple timeframes
- The $2,100 threshold is critical—it represents the average cost basis for addresses holding over 100,000 ETH
- 30-day realized volatility has climbed to approximately 0.97, approaching levels last seen in March 2025
- Over $220M in short positions were wiped out across two trading sessions, while funding rates have shifted to positive territory
- ETF outflow momentum is decelerating, although strong accumulation patterns haven’t materialized
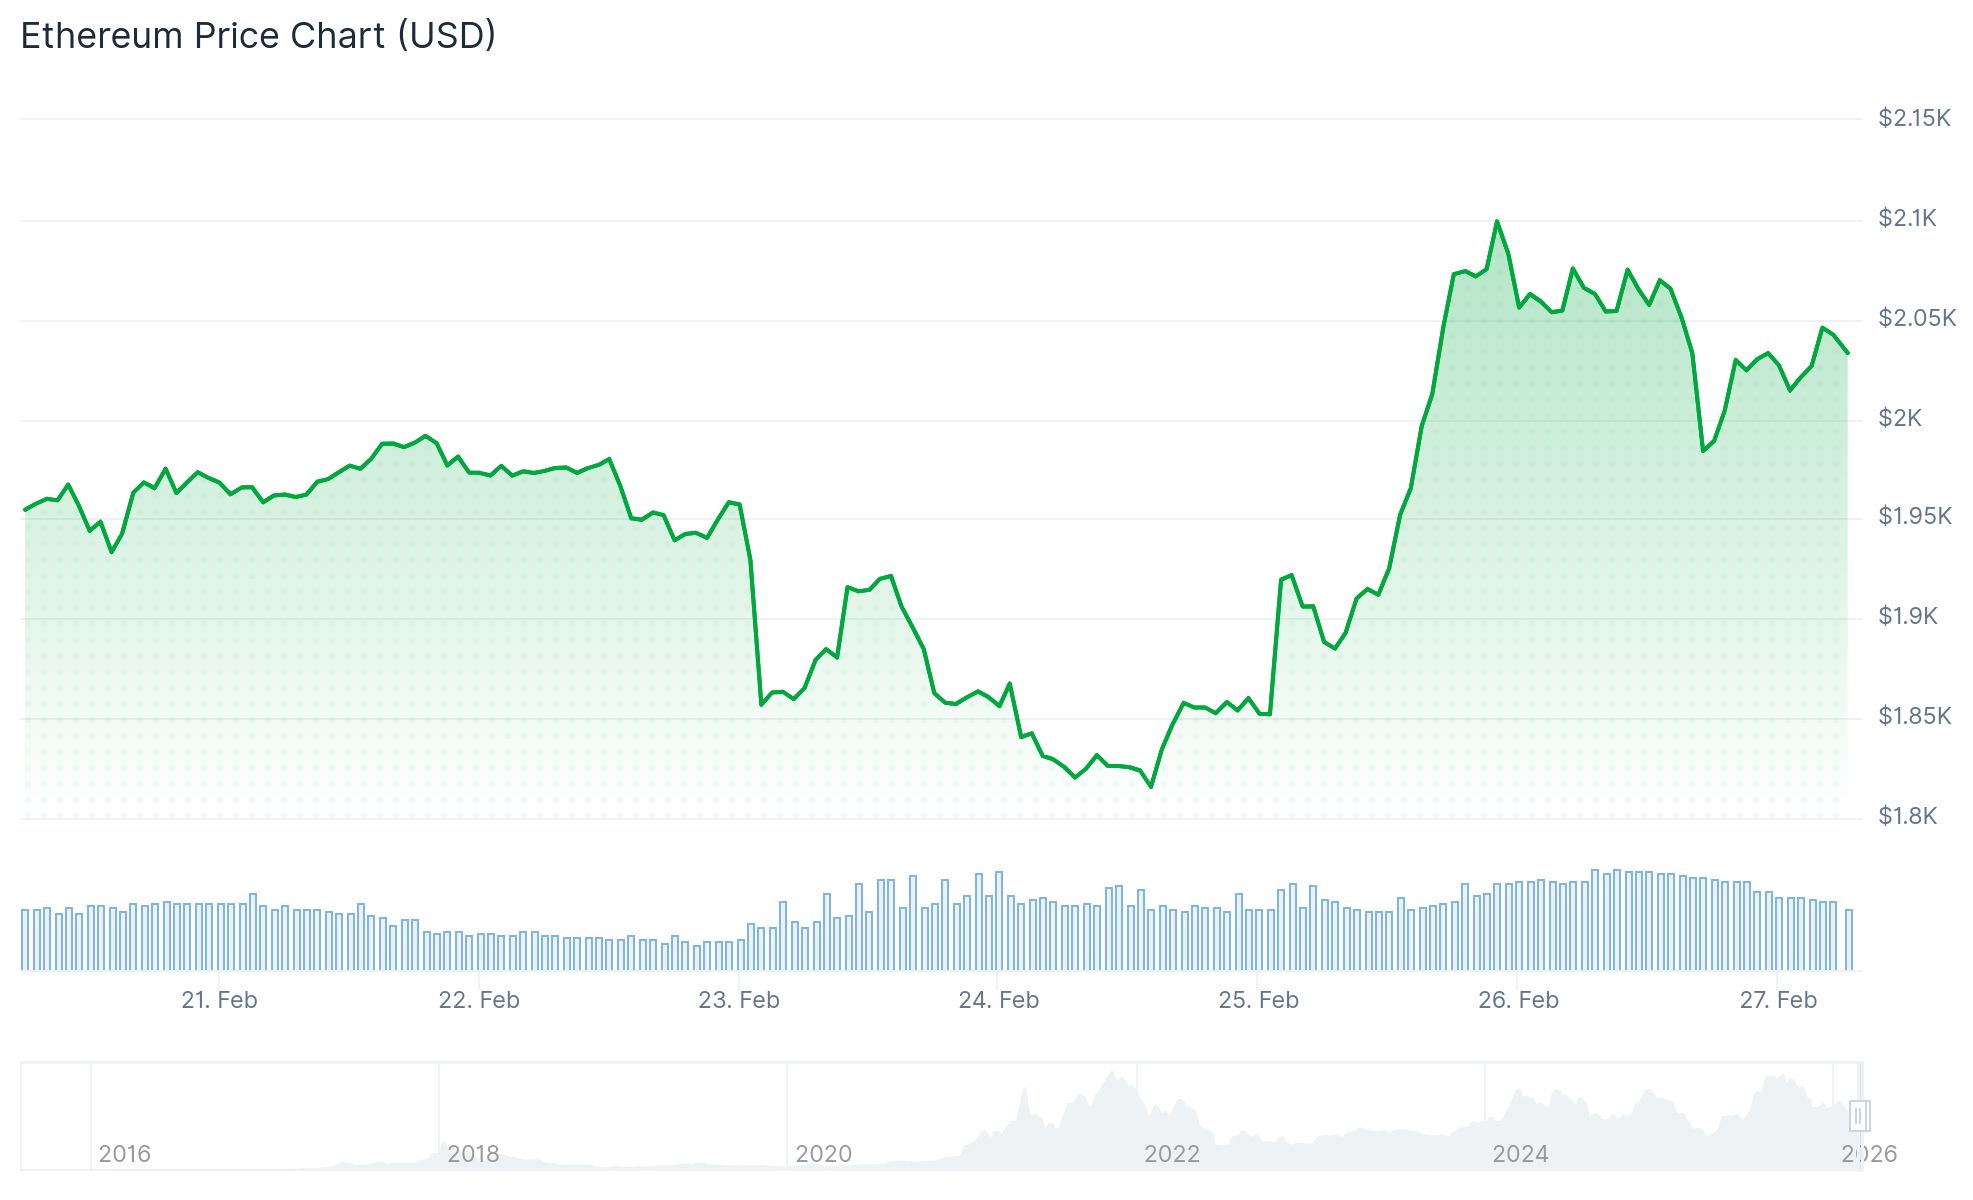
Ethereum pushed toward a weekly peak of $2,150 on Thursday before experiencing a retracement. The digital asset continues to consolidate within a defined range, with $2,000 serving as crucial support and $2,100 representing the immediate overhead resistance.
Why does breaking above $2,100 on a daily closing basis carry significance? This price point corresponds with the realized price for wallet addresses containing at least 100,000 ETH. The realized price metric calculates the average price at which coins last changed hands, offering insight into whether major stakeholders are positioned profitably or underwater.
Historical data from 2020 onwards reveals that ETH has rarely sustained trading beneath this whale cohort’s average entry price, with the 2022 bear cycle representing the most pronounced exception. Previous tests of this threshold have consistently preceded price recoveries.
Futures and Funding Rates
The derivatives market witnessed more than $220 million in short position liquidations during the previous 48 hours, effectively wiping out concentrated bearish leverage. Binance funding rates, which plunged deeply negative early this month as bearish speculators accumulated positions, have reversed course to reach positive 0.23%.
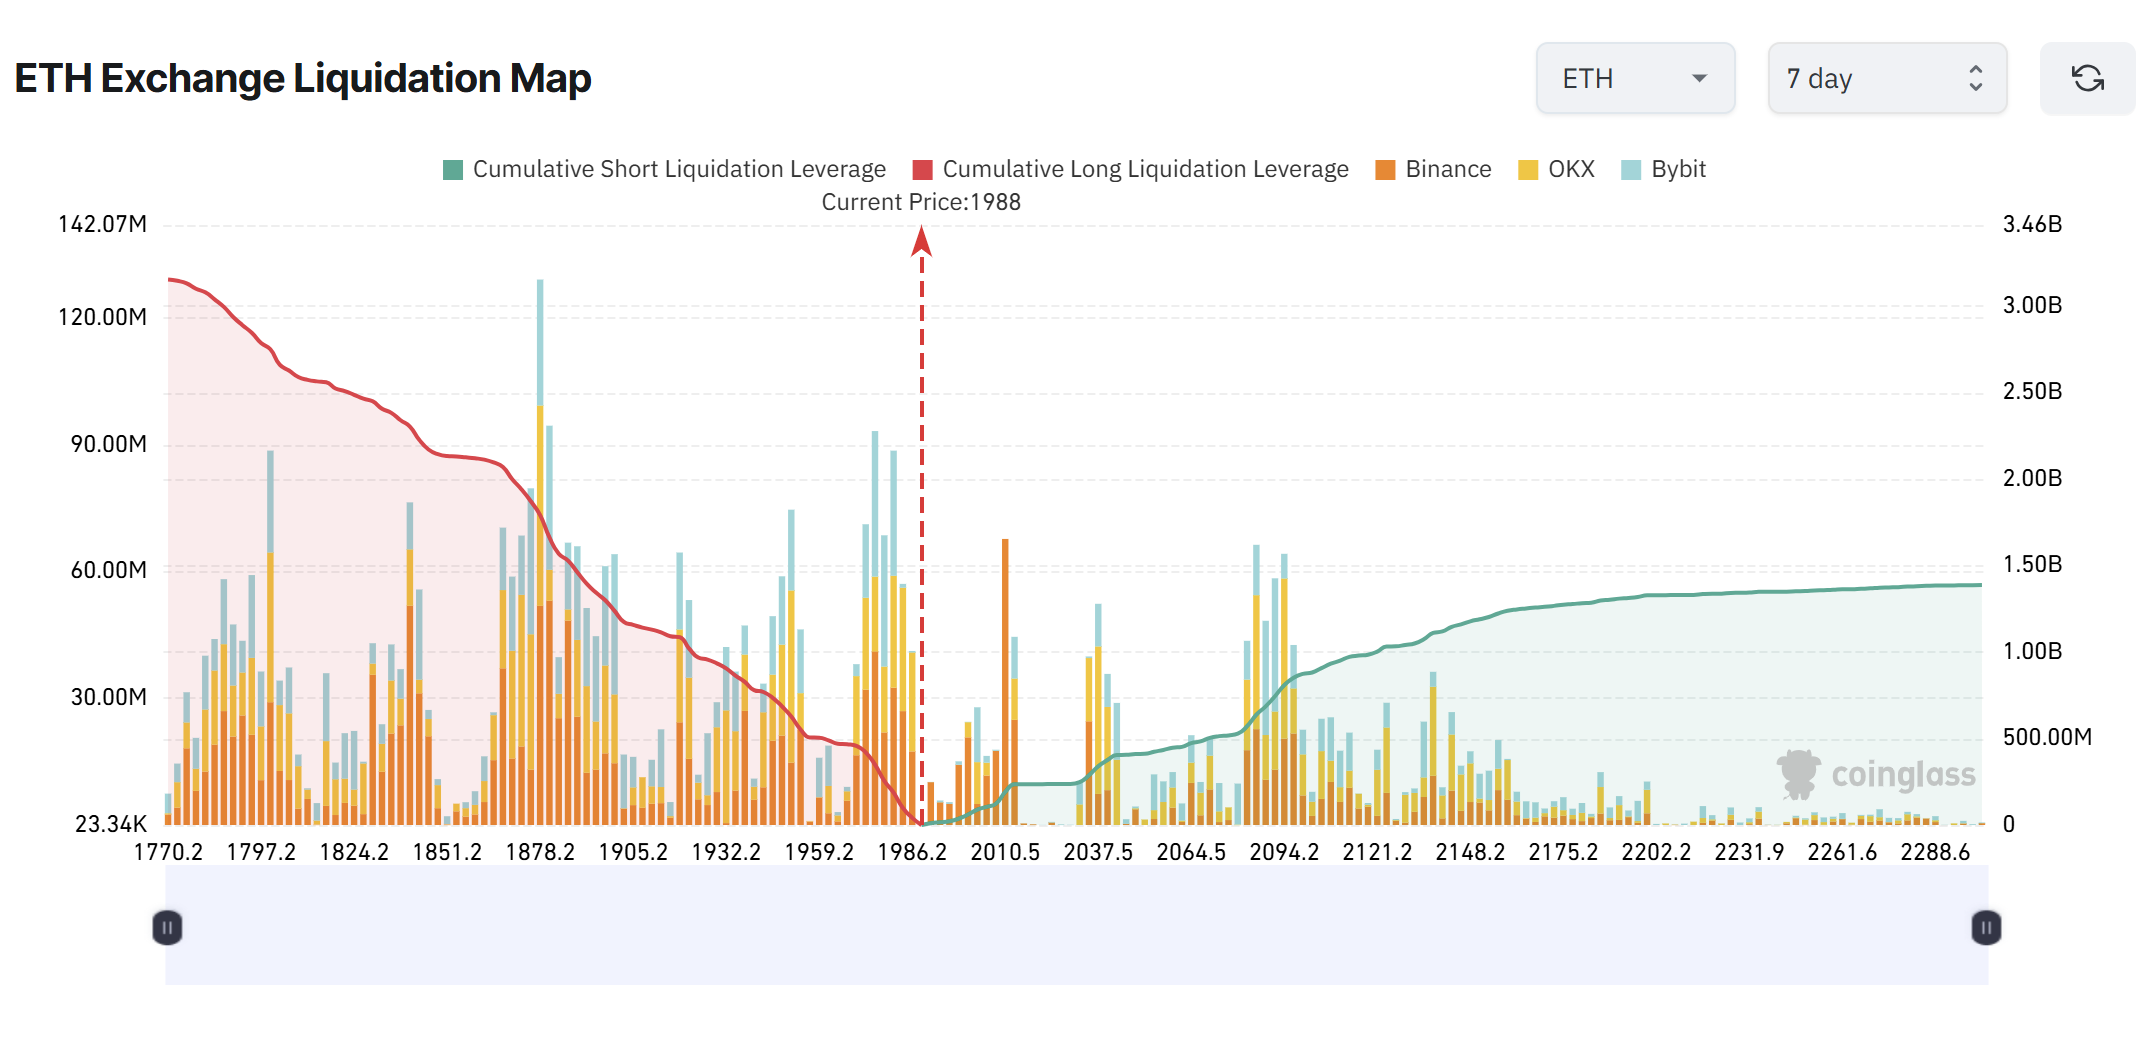
This reversal indicates that traders who entered short positions at inopportune times have been forced to exit. Nevertheless, with funding rates now climbing into positive territory, the market is increasingly tilted toward long positions, creating potential for a counter-squeeze toward $1,800 should upward momentum falter.

Approximately $2.66 billion in long position liquidation exposure is concentrated around the $1,800 price level, establishing a substantial liquidity pool beneath current valuations.
Volatility and ETF Flows
Ethereum’s 30-day realized volatility measured on Binance has escalated to nearly 0.97, marking the highest level recorded since March 2025. Heightened volatility during this phase often indicates price discovery rather than established trend continuation.
The asset continues trading beneath its 50-day, 100-day, and 200-day moving averages. Each rally attempt following the rejection near $4,800 in late 2025 has established progressively lower peaks, a structural pattern indicating persistent distribution pressure.
Regarding exchange-traded fund activity, the pace of redemptions has moderated considerably. Following substantial outflows throughout mid-2025, recent flow metrics demonstrate reduced magnitude in either direction. Institutional distribution appears to be waning, though convincing accumulation evidence remains absent.
Market analyst Leon Waidmann observed that capitulation by weak holders has largely concluded. Short interest is contracting, while leveraged long positions have been hesitant to rebuild at comparable scale.
Technical strategist IncomeSharks identified three overhead resistance zones, including repeated SuperTrend indicator rejections and channel resistance approaching $2,250. The analyst additionally highlighted the April lows around $1,500 as a critical level should buying momentum dissipate.
ETH was trading at $2,034 at time of writing.
Get 3 Free Stock Ebooks
Discover top-performing stocks in AI, Crypto, and Technology with expert analysis.
- Top 10 AI Stocks - Leading AI companies
- Top 10 Crypto Stocks - Blockchain leaders
- Top 10 Tech Stocks - Tech giants


